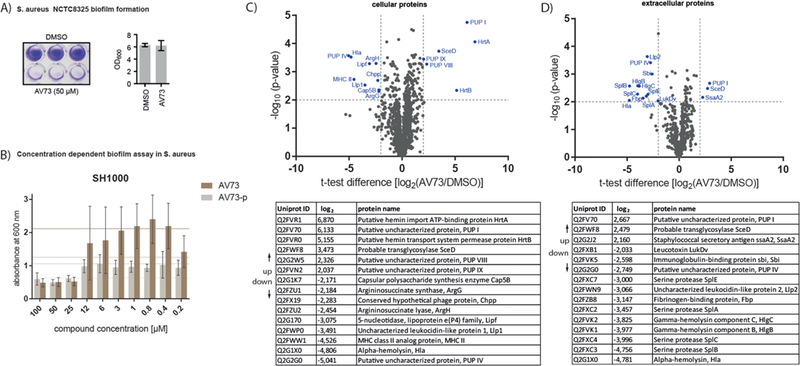
Figure 2.

(A) Biofilm assay of AV73 at 50 μM and DMSO in S. aureus NCTC8325. Biofilms of bacteria were grown under static conditions in 96-well plates and were stained with crystal violet. Bacterial growth with and without AV73 was determined by OD600 measurement. (B) Concentration dependent biofilm assay of AV73 and AV73-p in S. aureus SH1000. Solid line represents the DMSO control, the dashed line is half the OD600 of the DMSO control. The experiment was performed in three biological replicates. MBIC50 (AV73) < 25 μM, MBIC50 (AV73-p) < 30 μM. The high OD600 difference between the two compounds is due to the inconsistent biofilm growth, which especially occurs without inhibition. (C) Whole proteome analysis of cellular proteins, performed under biofilm conditions in four biological replicates. Most significantly regulated proteins are marked and listed after decreasing t test difference. Cutoff lines were set aminimum log2 fold-change of 2 and a minimum −log10 (p-value) of 2.(D) Whole proteome analysisof extracellular proteins performed in four biological replicates. Most significantly regulated proteins are listed. Cutoff lines were set at a minimum of log2 fold-change of 2 and a minimum −log10 (p-value) of 2.
