Fig. 5.
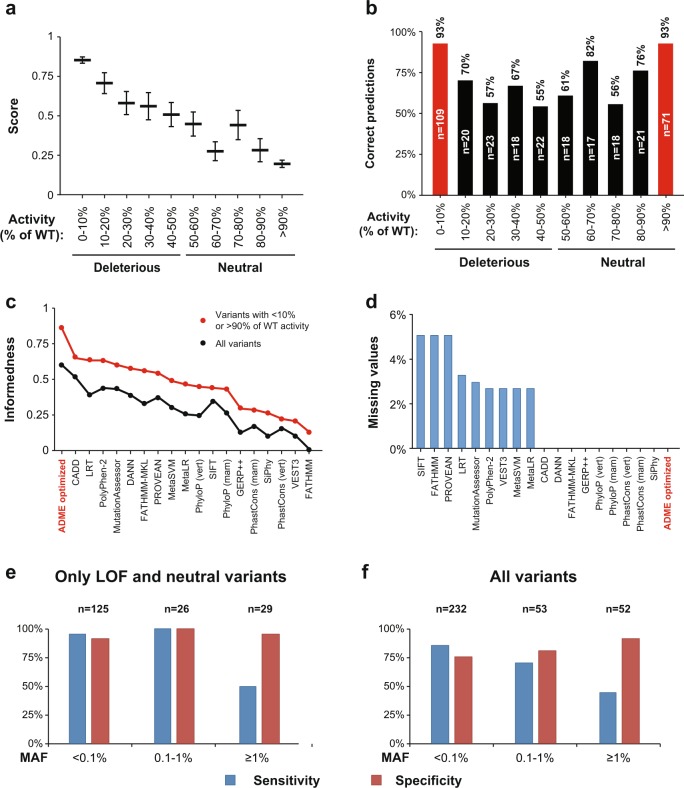
The ADME optimized model provides quantitative estimates of functional variant effects. a The score provided by the ADME optimized prediction model correlates quantitatively with the level of gene product functionality determined experimentally in vitro (R2 = 0.9, p = 2.9 × 10⁻⁵). Highest scores are provided for LOF variants with <10% of WT functionality (0.84 ± 0.02 s.e.m.), while variants that do not affect gene product functionality receive lowest scores (0.19 ± 0.02 s.e.m.). Data is plotted as mean ± s.e.m. b 93% of variants that resulted in severely decreased functionality in vitro (<10% activity of WT) were correctly classified as deleterious, whereas variants whose effect on functionality was only moderate (decreased functionality variants; 10–50% activity of WT), were flagged with lower probabilities. Similarly, variants that showed equivalent activity than WT (>90%) were more likely to be flagged as functionally neutral (93% specificity) than variants with 50–90% of activity. c Levels of informedness are shown for all variants (black) and variants with <10% and >90% of WT activity (red curves corresponding to red columns in b). Note that the ADME optimized prediction framework achieved the highest values of informedness, irrespective of which variants were considered. d Overview of the fraction of variants for which no prediction could be obtained by the individual algorithms. While SIFT, FATHMM and PROVEAN did not return predictions for 5% of variants, CADD, DANN, SiPhy, PhastCons, PhyloP, GERP and the ADME optimized model provided assessments for all non-synonymous variants analyzed here. e, f Column plot depicting sensitivity and specificity of the ADME optimized prediction model for LOF and functionally neutral variants (e) or all variants (f) depending on their minor allele frequencies (MAF). Note that predictive measures are higher for very rare (MAF < 0.1%) and rare variants (0.1% ≤ MAF < 1%) compared to common variants (MAF ≥ 1%). vert vertebrate, mam mammalian

