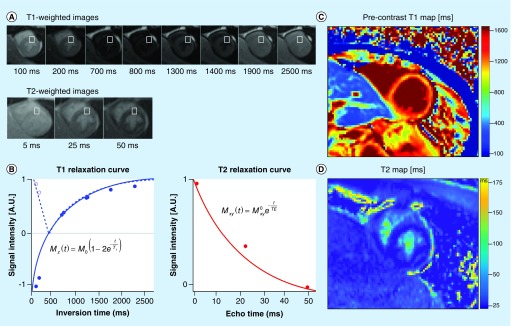
Figure 4. . T1- and T2-mapping are quantitative cardiac MRI biomarkers that reflect changes in myocardial microstructure.
(A) A series of cardiac images are acquired at different times after an ‘inversion pulse’ that manipulates the longitudinal magnetization and the corresponding image contrast. Alternately, in (B) a series of images are acquired after different durations of ‘T2 preparation’ that manipulates the transverse magnetization and the corresponding image contrast. (B) Curve fitting is performed on a pixel-wise or region of interest basis (white boxes) and used to estimate the local tissue's T1 and T2. The signal intensities (dots) represent the relative magnitude of the magnetization used to produce each of the images. Solid curves represent the curve fit for the equation in each plot. Additionally, the T1 plot shows the dashed curve with the first few data points not inverted about the ‘null-point’ – where signal from myocardium is suppressed (∼700 ms). After curve fitting (C) T1- and (D) T2-maps are generated on a pixel-wise basis.

