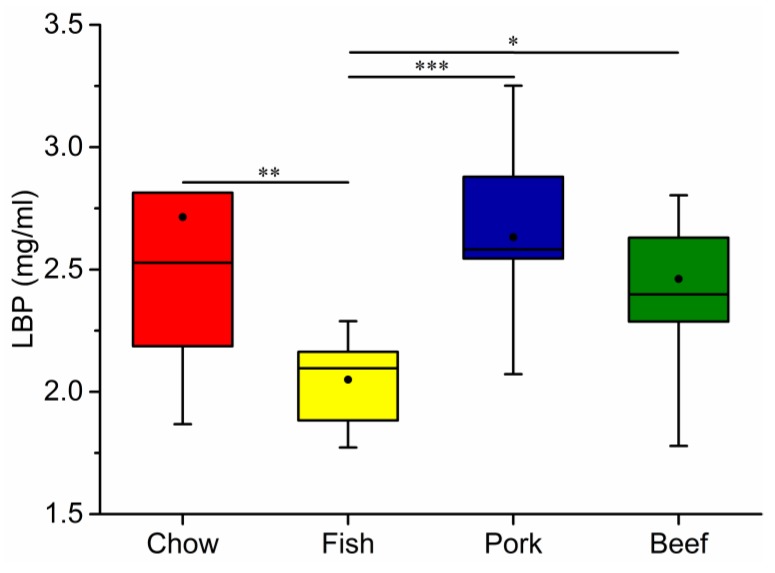
Figure 4.
Changes in serum lipopolysaccharide-binding protein (LBP) levels of mice fed laboratory chow, fish, pork, or beef. The numbers of mice in each group were: chow, 10; fish, 10; pork, 10; and beef, 9. Whiskers in the boxplot represent the range of minimum and maximum alpha diversity values within a diet group. The black dot in the boxplot is the mean. The horizontal line in the boxplot is the median. * p < 0.05, ** p < 0.01, *** p < 0.001.

