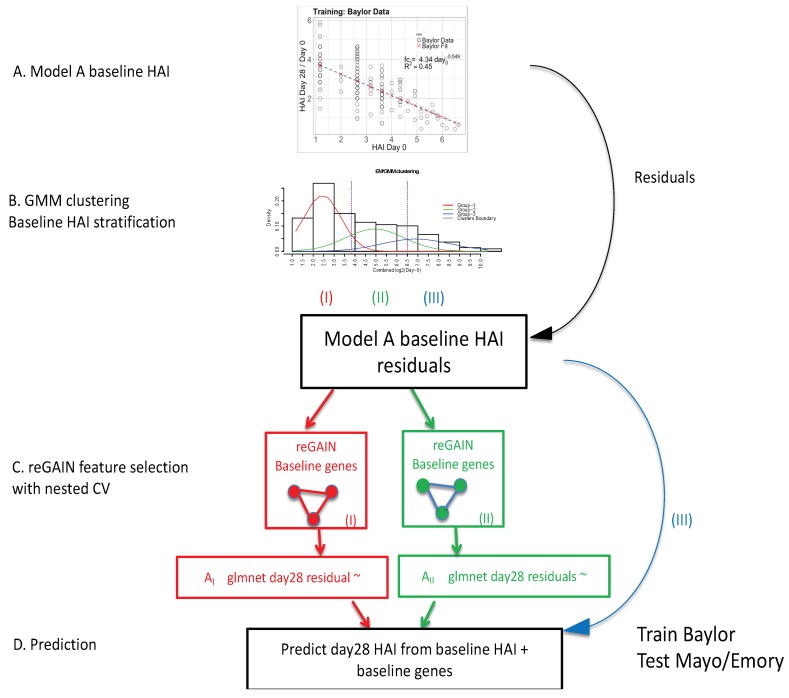
Figure 1.
A diagram of the overall modeling approach in four parts. (A) Inverse power model is used to model the pre−existing hemagglutination inhibition (HAI) antibody titer (day-0 HAI). The horizontal axis is the day-0 HAI, and the vertical axis is the ratio of day-28/day-0 (fold-change) according to the inverse power model. (B) Day-0 HAI in all data sets are combined and clustered into three groups (low (red I), medium (green II), and high (blue III)) using Gaussian mixture modeling (GMM) clustering. (C) The regression-based genetic association interaction network (reGAIN) method is used to compute the weighted matrix for gene pairs through 10-outer/10-inner nested cross-validation (CV), and top 200 interacting genes with highest reGAIN values are selected as predictor variables in two of the baseline groups (low/red and medium/green). We excluded the third group (high day-0, blue) since the power law model works well in that group. (D) Final gene modeling using glmnet penalized regression, where the dependent variable is the residual from A, and predictor variables are the top 200 gene ratios from C. In gene modeling, we again trained on the Baylor data and tested on Emory and Mayo data for each group, separately.

