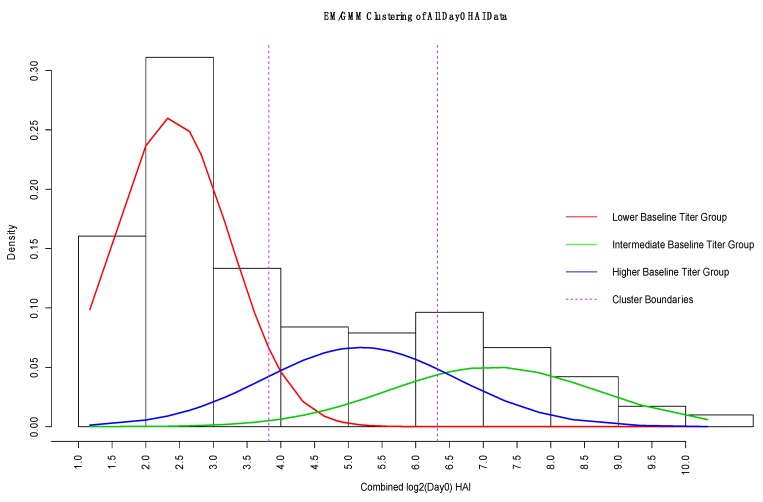
Figure 4.
Gaussian Mixture Model (GMM) estimate of densities of day-0 HAI (log2) for combined data. The red density represents the lower baseline titer group, the green density is the intermediate baseline group, and the blue density represents the higher baseline titer group. The vertical dashed lines indicate the different group boundaries based on the maximum posterior probability. We used these boundaries to identify the cutoff points for creating the low, medium, and high day-0 titer groups for gene−based modeling.

