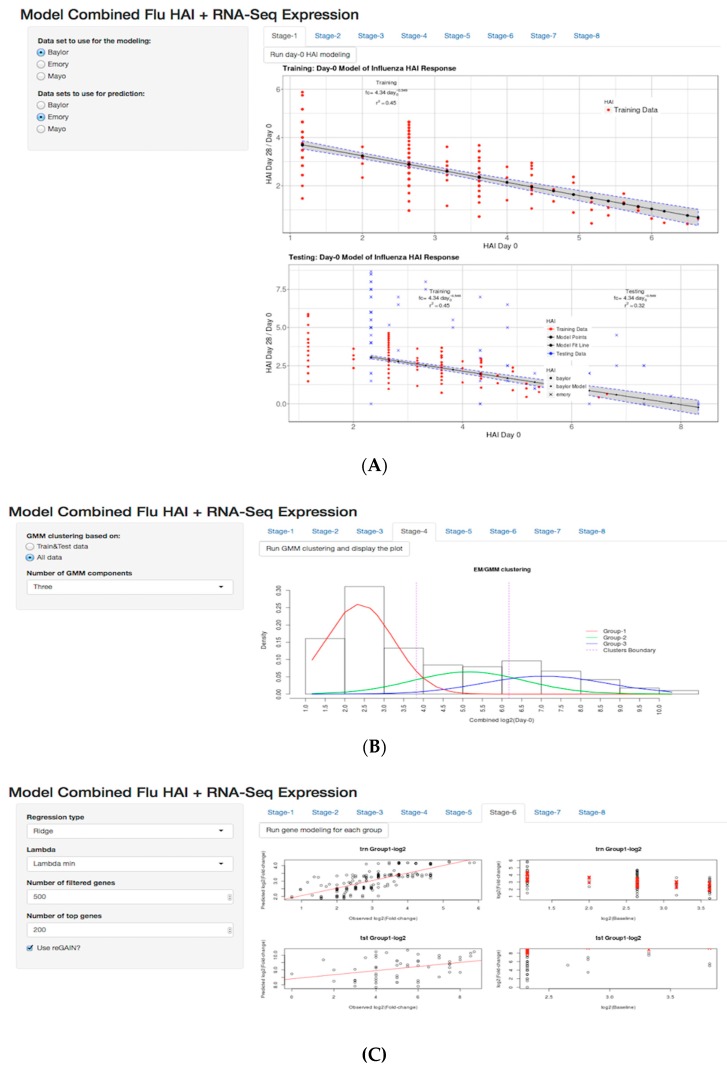
Figure 7.
R Shiny App for modeling of flu vaccine HAI response. Sidebar panel displays the settings and main panel displays the result of modeling. (A) Sidebar panel displays options specifying the training and testing datasets. (B) Sidebar panel displays customization of the number of clusters, (C) selection of the regression modeling method, and (D) the number of genes filtered, including a download button for top 200 genes, where users are able to select the train and test data sets, The user can run the analysis for each tab and produce plots. Pre−loaded datasets are available by default in RData format. The web based app and source code are available at https://github.com/insilico/predictHAI and http:// insilico.utulsa.edu/predictHAI.


