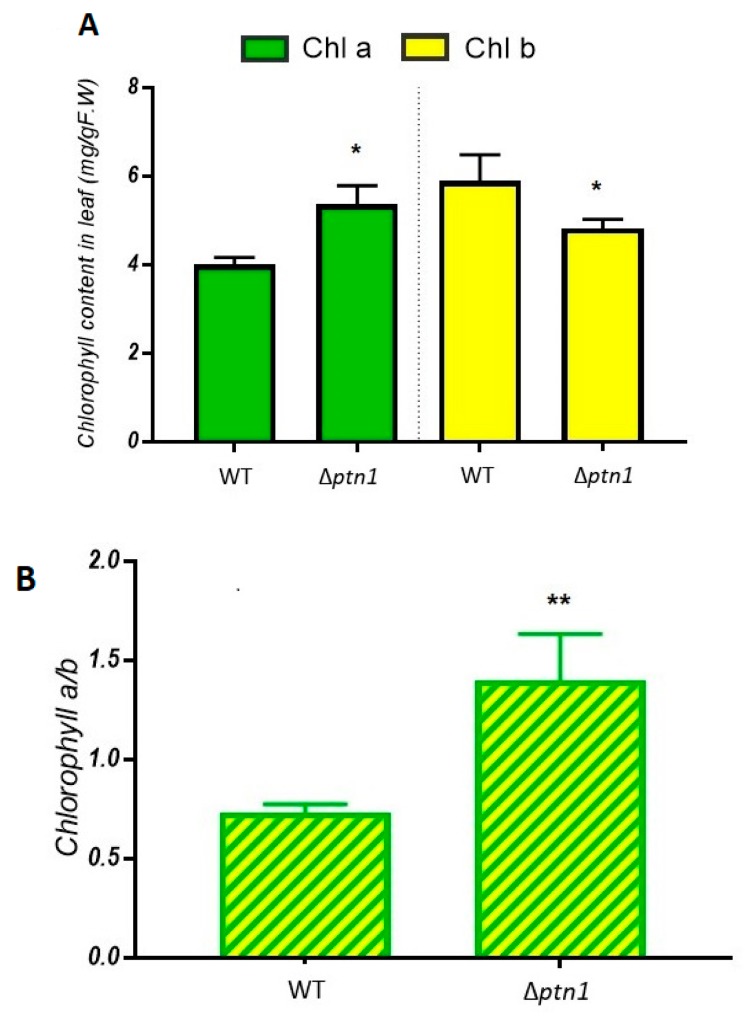
Figure 8.
Chlorophyll estimation. (A) Chlorophyll count of leaves of plants infected with WT (1/2 a1b1 × 2/9 a2b2), Δptn1 (a1b1 × a2b2) and ptn1otef (a1b1 × a2b2) were measured using the DMSO method [31]. (B) The plants infected with the Δptn1 strains had higher a/b ratios, and such plants had chlorophyll levels that were more comparable to “mock” infections. Means of chlorophyll a, chlorophyll b, and chlorophyll a/b ratio were marked with an asterisk (*) or two asterisks (**) were significantly different (p ≤ 0.05) and (p ≤ 0.01), respectively, by Tukey’s test.

