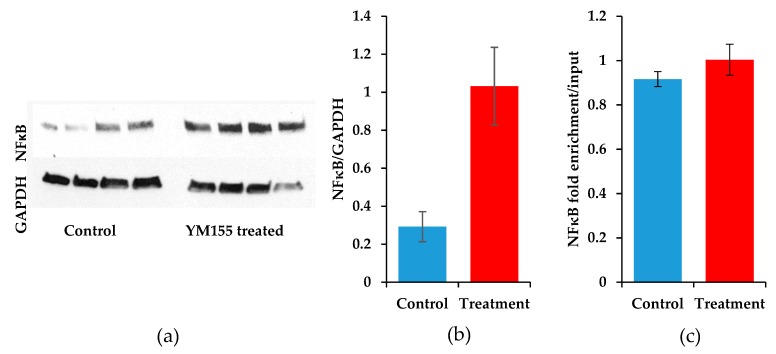
Figure 8.
NFκB expression and Birc5 promoter binding in response to YM155. (a) Immunoblots of NFκB expression (top) and GAPDH (bottom) in control and YM155 treated mice after 11 days. (b) Quantification of band intensities of NFκB normalized to GAPDH expression, error bars for samples are SEM (p = 0.015). (c) ChIP-qPCR for NFκB demonstrates near equal levels at the Birc5 promoter between the YM155 treated HS-SY-II samples (n = 3) compared to controls (n = 3), error bars for treated samples are SEM (p = 0.32).

