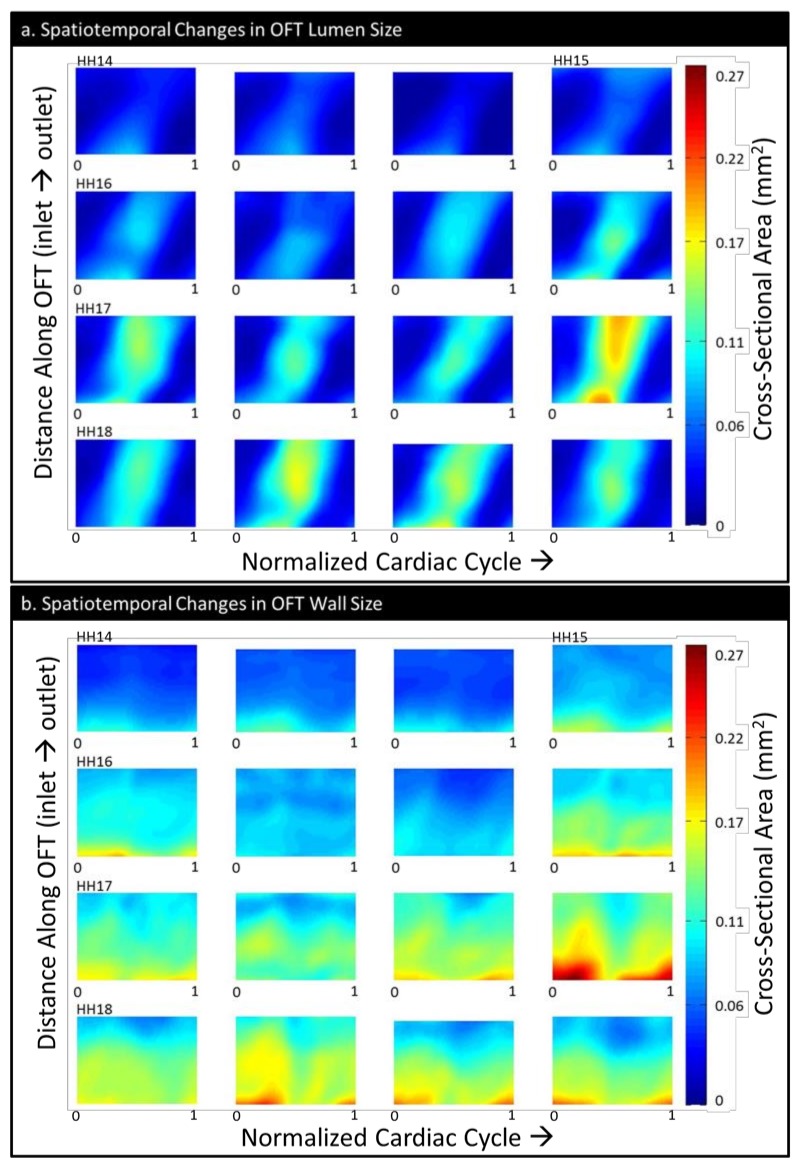
Figure 5.
The OFT size depicted as the color-coded area of its cross sections over time (normalized cardiac cycle, horizontal axis) and space (normalized OFT length, inlet to outlet, vertical axis): (a) the spatiotemporal changes in the OFT lumen cross-sectional area and (b) the spatiotemporal changes in the OFT wall (cushions plus myocardium) cross-sectional area. The embryos have been ordered from youngest to oldest within each stage group and aligned in rows by stage.

