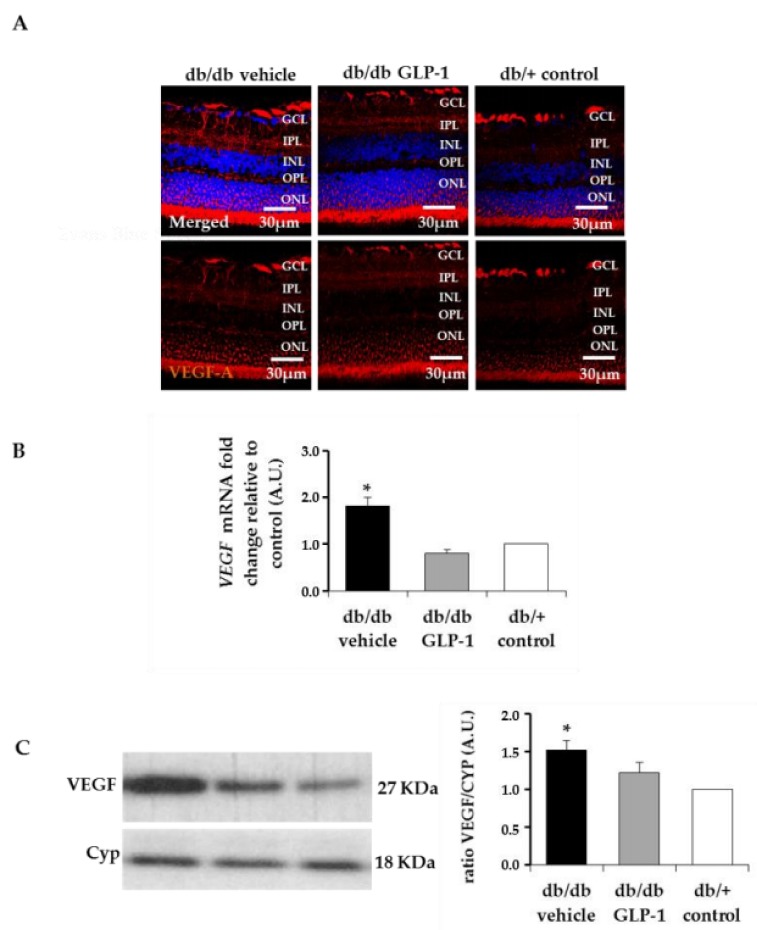
Figure 11.
(A) Immunofluorescence of VEGF. Scale bars, 30 µm. Nuclei were labelled with Hoechst stain (blue); (B) Real-time quantitative reverse transcription polymerase chain reaction (RT-PCR) analysis of VEGF A in db/db mice treated with vehicle (black bars), db/db mice treated with glucagon-like peptide-1 (GLP-1) eye drops (grey bars) and non-diabetic mice (white bars) n = 4 * p < 0.05 in comparison with the other groups; (C) Western blotting bands of VEGF and densitometric analyses in mouse retinas in db/db mice treated with vehicle (black bars), db/db mice treated with GLP-1 eye drops (grey bars) and non-diabetic mice (white bars) n = 4 * p < 0.05 in comparison with other groups; GCL, ganglion cell layer; INL, inner nuclear layer; IPL, inner plexiform layer; ONL, outer nuclear layer; OPL, outer plexiform layer.

