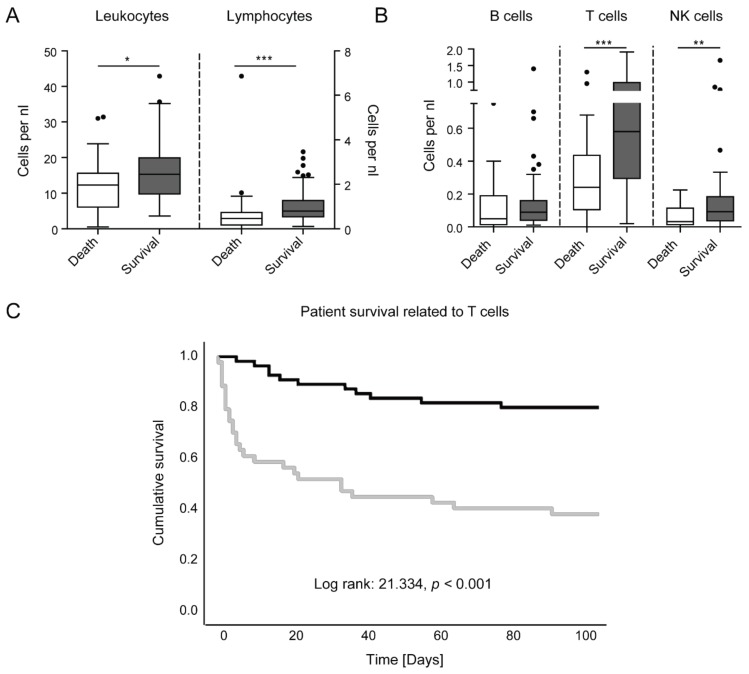
Figure 3.
Prognostic value of lymphocyte subsets in ICU patients. (a) Leukocytes and lymphocytes, as obtained at ICU admission, in patients who subsequently died or survived in the ICU. (b) Lymphocytes subset distribution at ICU admission in patients surviving or dying in the ICU. (c) Kaplan–Meier curve for T cells lower than or equal to 0.36 per nanoliter (grey) and higher than 0.36 per nanoliter (black) in ICU patients. Censored events are indicated by a crossing vertical line. Statistics: * indicates p < 0.05, ** p < 0.01, *** p < 0.001. For comparison of two groups, the Mann–Whitney U test was used. Cox regression was performed to determine the prognostic value. Cutoff values of the Kaplan–Meier curve were determined by the Youden index. Sample sizes: death n = 35, survival n = 70.

