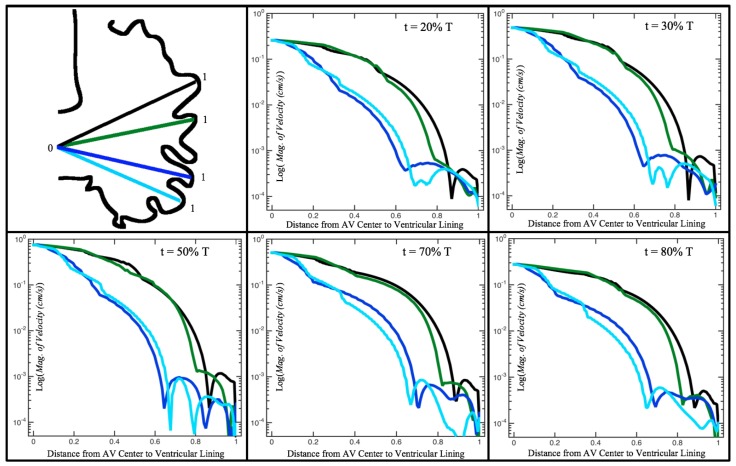
Figure 11.
Plots showing how the log magnitude of velocity decays from the center of the AV canal to the ventricle wall for four different lines across the chamber using a 5 dpf WT (I) embryo’s geometry at . The velocity decays until it reaches a trabeculae height away from the ventricle wall. Within pronounced trabecular valleys, the velocity increases before decaying further when measured closer to the ventricular lining. Each sub-figure corresponds to a different time during the pulsation cycle, described by a percentage of the pulsation period, T.

