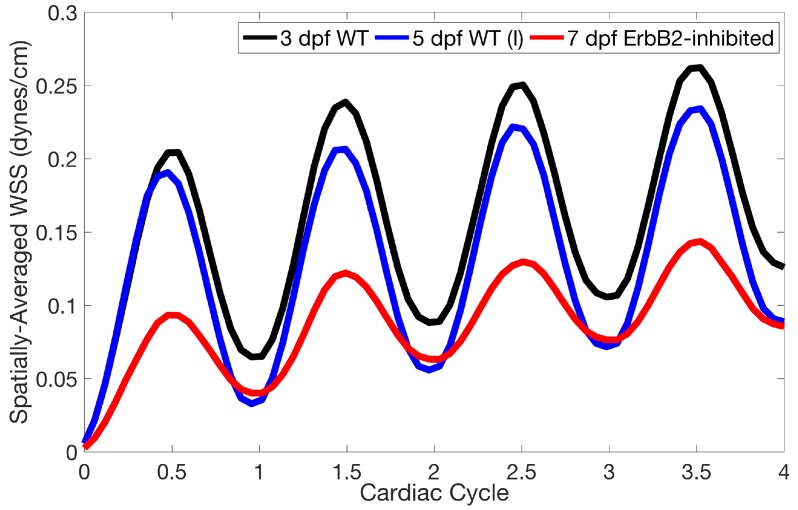
Figure 13.
A plot showing the spatially-averaged magnitude of wall shear-stress (WSS) over the ventricle during the first 4 pulsation cardiac cycles for the 3 dpf WT, 5 dpf WT, and 7 dpf ErbB2-inhibited zebrafish (ZF) for . The highest spatially-averaged WSS was in the 3 dpf WT ZF with the least in the 7 dpf ErbB2-inhibited ZF geometry.

