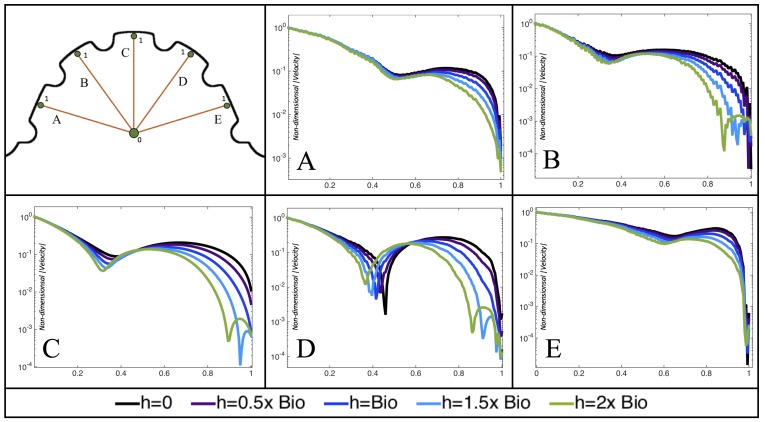
Figure 18.
Measurements of the non-dimensional magnitude of velocity are provided for the case quantified along a line from the intracardial center (labeled “0”) and extending to the ventricular lining (labeled “1”) for various intertrabecular regions and trabeculae heights. Each subfigure (A–E), corresponds to a different line between the intracardial center and ventricular lining in which the magnitude of velocity is measured. The velocity magnitude decreases from the center and then increases before decreasing again as one approaches a distance from the wall that is equal to the neighboring trabeculae heights. As one moves between the trabeculae, the velocity magnitude again increases, in some cases an order of magnitude, before dropping towards zero at the ventricle lining.

