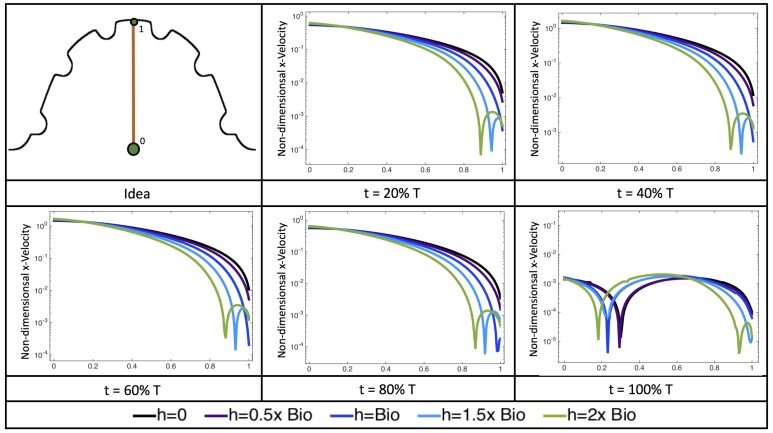
Figure 22.
Snapshots during a pulsation cycle in the case of the horizontal velocity measured from the intracardial center (labeled “0”) to the intertrabecular region (labeled “1”) directly above for multiple trabeculae heights. The trabeculae cause a drop in velocity as one nears the ventricular wall. Each sub-figure corresponds to a different time point described as percentge of the pulsation cycle, T.

