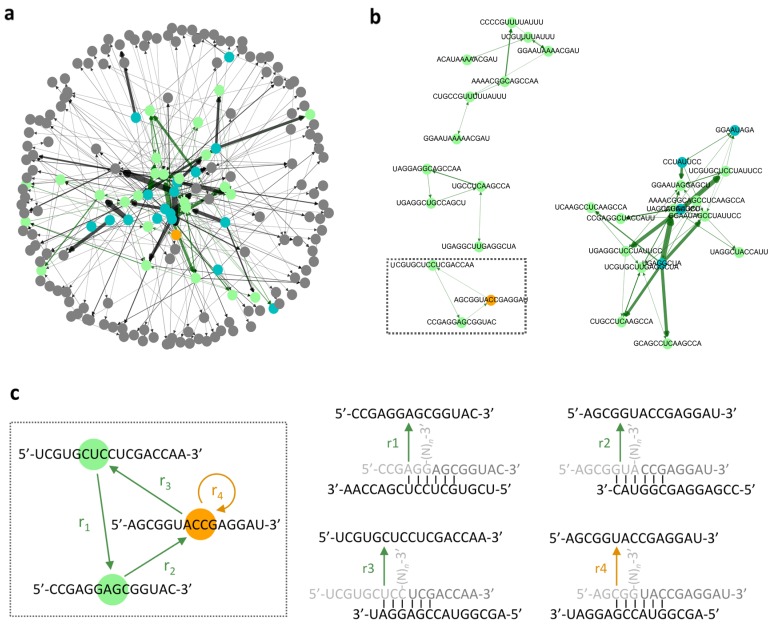
Figure 2.
An example of a directed graph. (a) All of the analyzed reactions. Each node (circle) represents an RNA in the original population (blue), an RNA that self-reproduced (orange), an RNA in an autocatalytic network (green), and an RNA that was not categorized in any of them (gray). A former color was used if a node fell into two or more categories. Each edge (arrow) represents a catalytic reaction, from a catalyst toward a product. The width of an edge is proportional to the frequency of each reaction. A collectively autocatalytic reaction is highlighted in green. (b) Reproducing RNAs in panel (a) are featured. (c) The three-component cycle in panel (b) is highlighted (enclosed in a dotted rectangle). All the template-directed recombination reactions (r1, r2, r3, and r4) constituting the network were detailed. The light and medium grey sequences are substrates, in which (N)n represents arbitrary nucleotides with length n (≥1). When a reaction could occur through multiple combination of base pairs, only one example was shown. The simulation was performed with 300X initial RNAs and X = 20 for 30,000X reaction steps. The maximum network size in panel (b) was 11.

