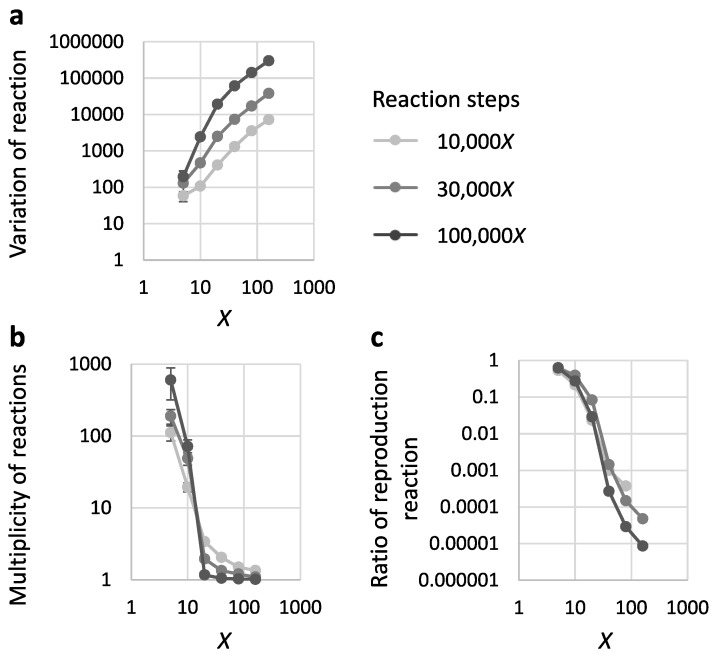
Figure 4.
Decreased multiplicity of reactions at increased sequence diversity within a population. The simulation was repeated 100 times with 300X initial RNAs for 10,000X, 30,000X, and 100,000X reaction steps. Each value was plotted against different diversities of an initial RNA population, X. (a) The variation of reactions during a simulation. (b) Average multiplicity of reactions during a simulation. (c) Average ratio of reproduction reactions among all the reactions during a simulation in which reproduction occurred. In all panels, the error bars indicate standard errors.

