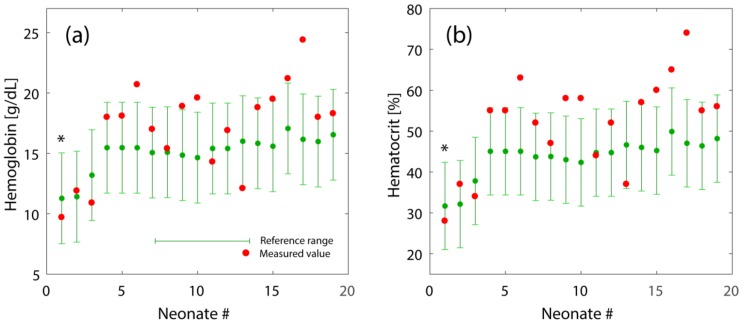
Figure 3.
Reference range of cHb (a) and Hct (b) obtained by equations 1–6 along with measured cHb and Hct values from clinically stable preterm neonates (n = 19) of different ages (GA and PNA). The order of neonates is shown with increasing GA. The asterisk indicates one neonate that received a blood transfusion.

