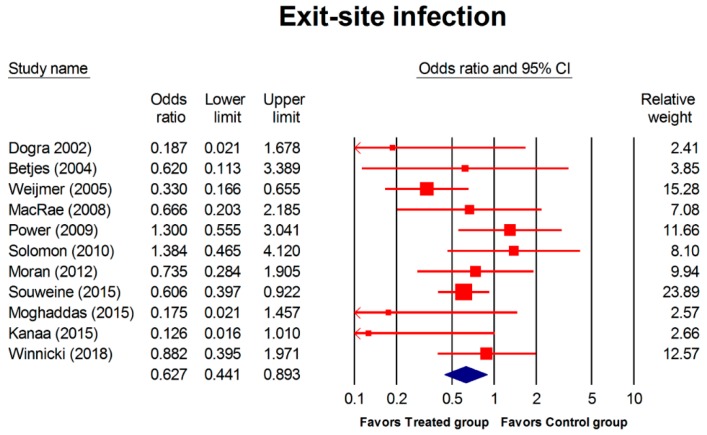
Figure 3.
Forest plot of the overall odds ratios for exit-site infection in treated group versus the control group. The random model of overall odds ratio for exit-site infection showed a significant overall effect of interventions in reducing the risk for developing exit-site infection as compared with the control condition (OR, 0.627; 95% CI, 0.441–0.893; p = 0.001).

