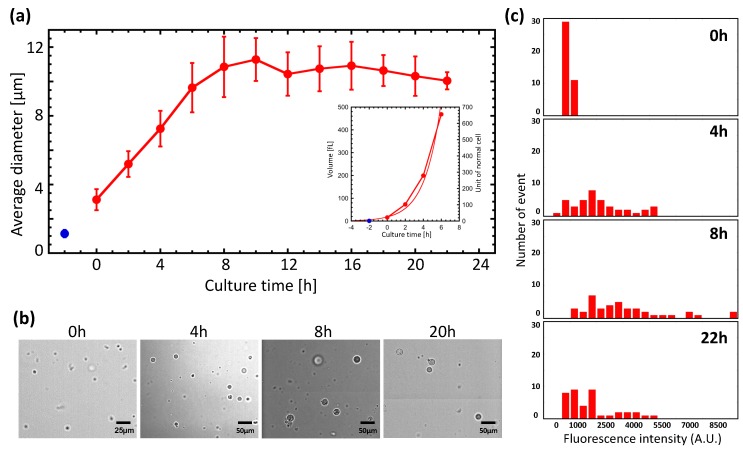
Figure 1.
Increased diameter and protein expression with a giant protoplast (GP) culture. (a) Plot of GP diameter versus incubation time. Red dots represent average GP diameters. The blue dot is the average diameter of Escherichia coli immediately after lysozyme treatment. The start of microscopic observation of the sample is indicated by 0 h. (b) Photographs of GP at different incubation times. (c) Histogram of GFP fluorescence intensity at different incubation times. At each culture time, IPTG was added to induce GFP expression, and after 2 h the fluorescence intensity was measured.

