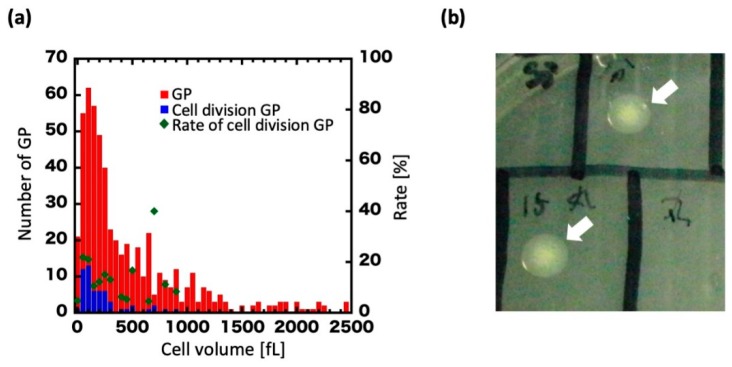
Figure 3.
Cell volume of regenerating GPs and colony formation. (a) Histogram of GP volume at 0 h. Blue dots show the volume of GPs that underwent cell division. Red dots show the volume of all GPs observed. Green dots show the percentage of GPs that divided at a given volume, which is defined as the ratio of blue dots to red dots (right vertical axis). (b) A colony formed on an agar plate (arrows).

