
Figure 7.
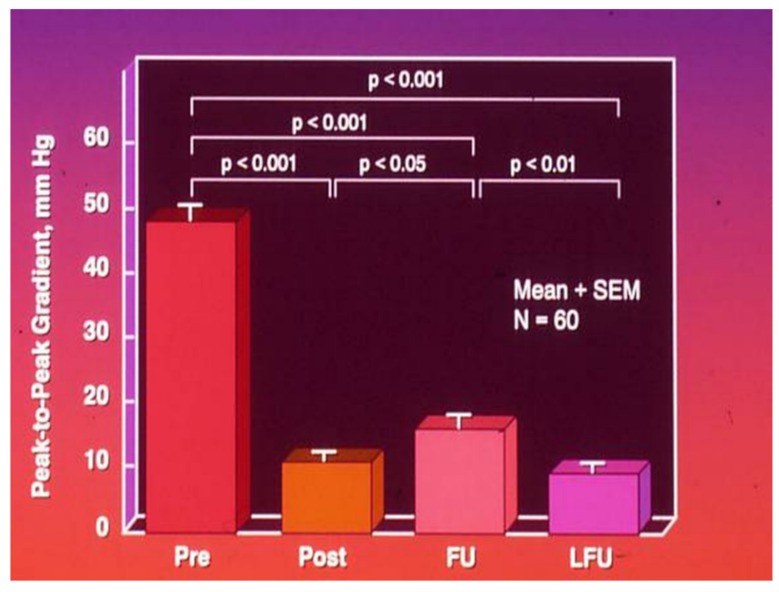
Bar graph of results following balloon angioplasty of native aortic coarctation are shown. Peak-to peak systolic pressure gradients across the coarctation decreased significantly (p < 0.001) from prior to (Pre) to immediately after (Post) balloon angioplasty. However, the gradient increased (p < 0.05) slightly at intermediate-term follow-up (FU). However, these gradients continue to be lower (p < 0001) than pre-angioplasty values. At long-term follow-up (LFU) arm-leg peak systolic pressure difference, measured by blood pressures, is lower than coarctation gradients prior to (p< 0.001) and at intermediate-term follow-up (p < 0.01). Mean + SEM (standard error of the mean) are shown. N, number of patients undergoing balloon angioplasty. Modified from Rao, P. S.; et al. J Am Coll Cardiol 1996; 27:462–70.