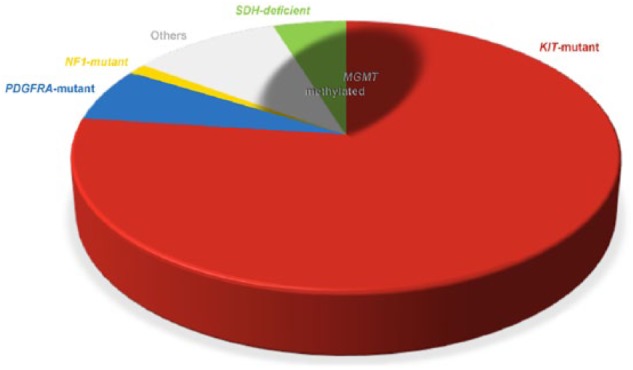
Figure 1.

Approximate distribution of MGMT methylation in GISTs, according to pathogenetic type. The pie chart illustrates the distribution of GISTs according to the molecular trigger.1 The shaded area, representing GISTs featuring MGMT methylation, involves about two thirds of SDH-deficient GISTs, one fifth of NF1-associated GISTs, two fifths of the other KIT/PDGFRA-WT GISTs, and slightly more than one twentieth of KIT mutant GISTs; no MGMT-methylated cases have been reported so far among PDGFRA mutant GISTs.
Source: Data from Ricci et al.19
GIST, gastrointestinal stromal tumor; MGMT, O6-methylguanine-DNA methyltransferase; SDH, succinate dehydrogenase.
