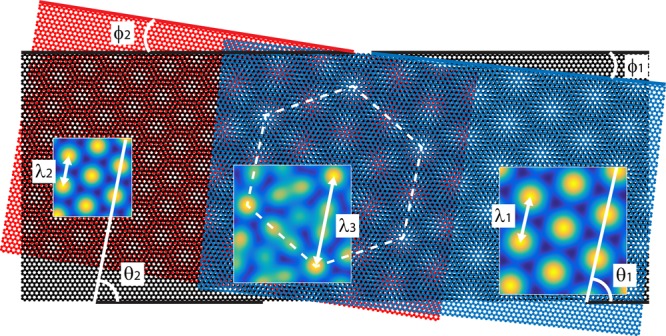
Figure 1.

Illustration of three different MSLs formed in a hBN/graphene/hBN heterostructure. Blue, black, and red hexagonal lattices represent top hBN, graphene, and bottom hBN lattices, respectively. ϕ1 (ϕ2) is the twist angle between top (bottom) hBN and graphene. θ1 (θ2) indicates the orientation of the corresponding MSL with respect to graphene. The resulting moiré periods are indicated with λ1,2,3. The 3L-MSL (middle part) has a larger period than both 2L-MSLs (left and right parts). Insets: moiré potential calculations.
