Figure 2.
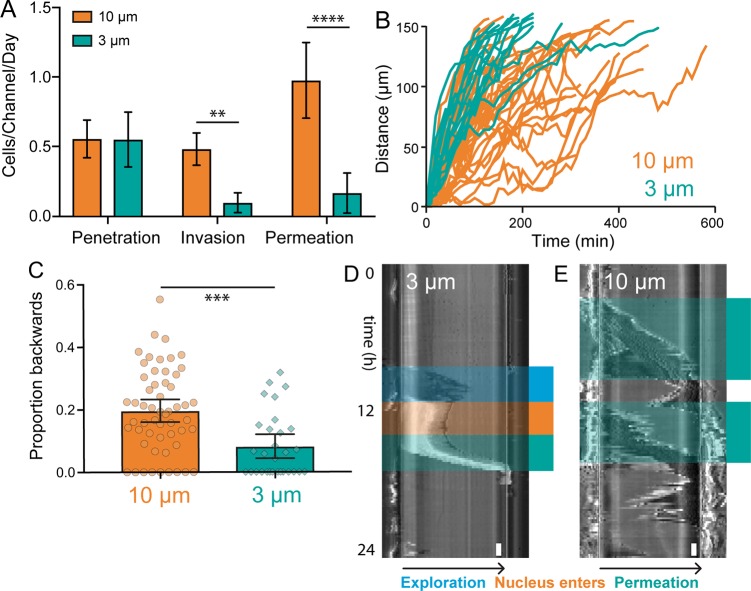
Channel permeation dynamics of MDA-MB-231 breast cancer cells. (A) The average number of MDA-MB-231 cells observed penetrating, invading, or permeating a single microchannel in 24 h. N = 28 for 10 μm channels and 21 for 3 μm channels. Error bars represent 95% confidence intervals. (** p < 0.01, **** p < 0.0001, ANOVA, F = 11.11, DF = 108). (B) Plot of the position of the leading edge of MDA-MB-231, BT 549, and HS578T breast cancer cells vs time during microchannel permeation. N = 28 for 10 μm channels and 21 for 3 μm channels. N = 55 for 10 μm and 30 for 3 μm. (C) The proportion of “steps” taken backward, or toward the channel entrance, during the entire permeation process. Each data point represents a single cell. Cells that only moved forward during permeation are observed on the x-axis. N = 55 for 10 μm and 30 for 3 μm. Error bars represent 95% confidence intervals. (*** p < 0.001, t test, t = 4.081, DF = 83). (D, E) Kymographs illustrating representative cell dynamics during permeation in 3 μm (D) and 10 μm (E) microchannels. Time proceeds from top to bottom and the cells enter the microchannel on the left and exit on the right. Distinct phases of exploration (blue), nuclear entrance (orange), and permeation (green) are identified. Scale bar = 1 h (lower right).

