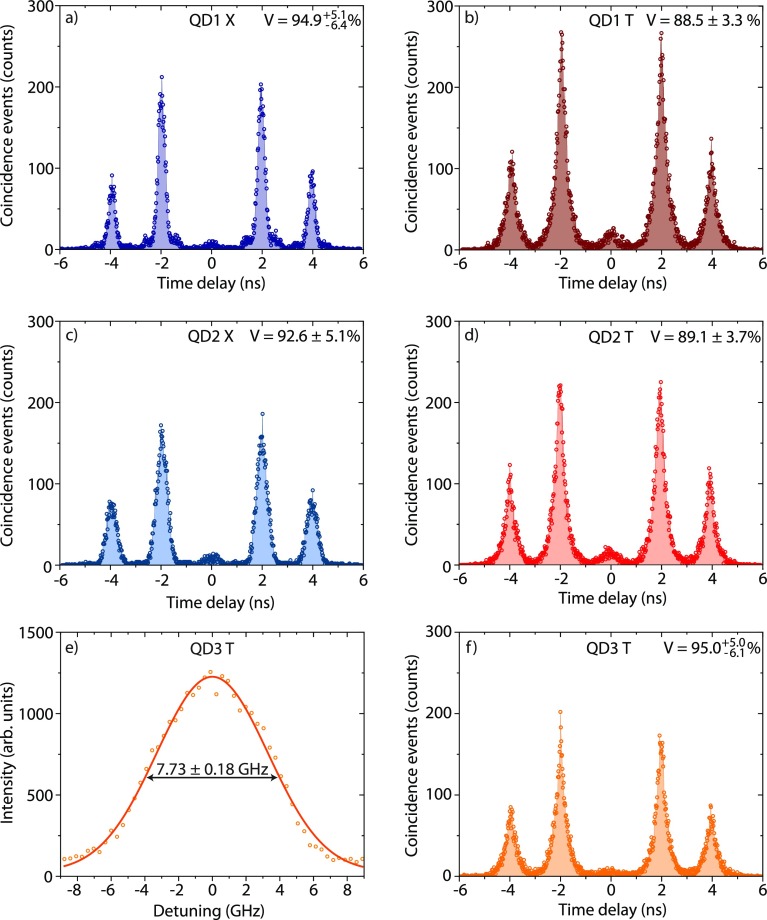
Figure 4.
Hong–Ou–Mandel measurements under resonant s-shell
excitation for the (a) neutral exciton of QD1  , (b) trion of QD1
  , (c)
neutral exciton of QD2
  , (d)
trion of QD2
  , and (f) trion of QD3
  . The visibilities are calculated by summing
up the peak areas of the three center peaks. The method is explained
in more detail in the Supporting Information; (e) line width of the trion of QD3 with a Gaussian fit
  .
.

