
Figure 1. Identification of fetal pancreatic cell types.
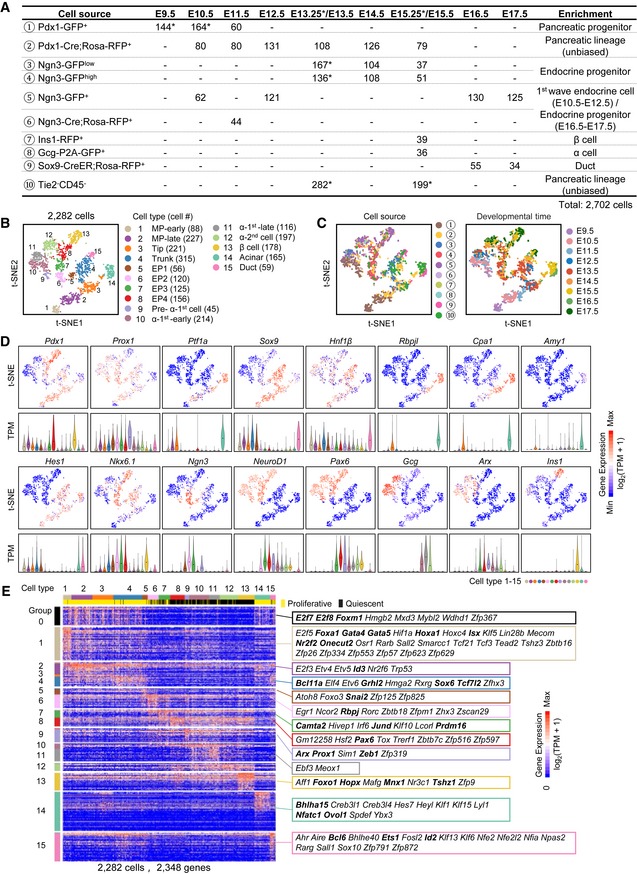
- Overview of the 2,702 fetal pancreatic cells analyzed in this study. The numbers show the cell counts from the indicated mouse strains at different developmental time points. The mouse strains (cell sources) are numbered with the circled numbers. * represents the indicated population including the cells from published resources (see Fig EV1A for details).
- The t‐SNE plot shows 15 distinct cell types. Each dot represents a single cell. Cell counts are labeled in brackets.
- The t‐SNE plots show the enriched cell source (left), the circled number indicating the cell source labeled in (A), and developmental time (right).
- Expression levels of marker genes are projected onto t‐SNE plots. The colors ranging from blue to red indicate low to high relative gene expression levels. The violin plot under the t‐SNE plot shows the expression level (TPM) of the indicated gene in each cell type. The dot within each violin plot indicates the median of expression levels.
- Heat map of cell type‐enriched genes. Each column represents a single cell, and each row represents one gene. Cell cycle‐related genes were extracted as group‐0. TFs of each gene group are labeled. The bolded TFs are known to be important for pancreas development. The colors ranging from blue to red indicate low to high relative gene expression levels.