
Figure EV1. The strategy for enriching pancreatic lineages from mouse embryos.
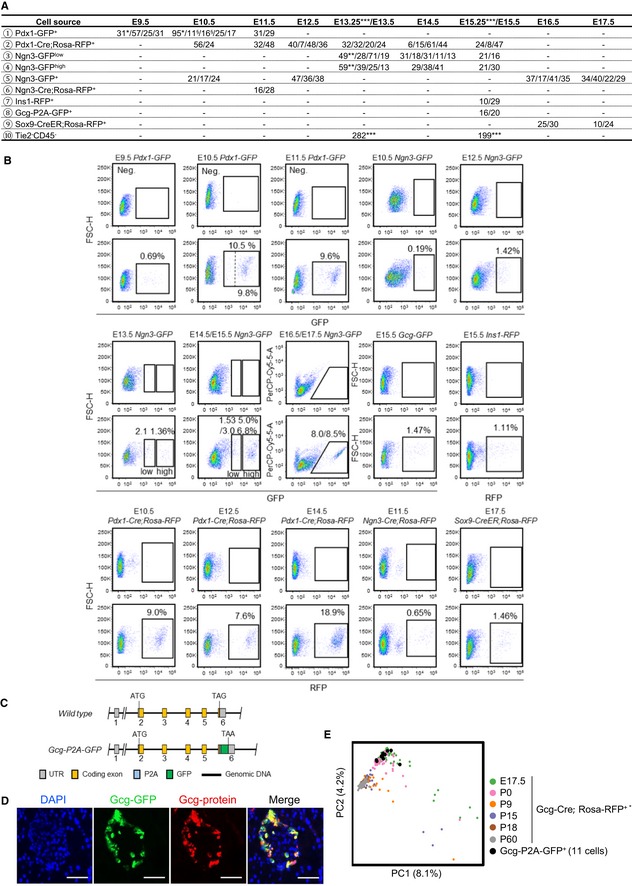
- Overview of the 2,702 fetal pancreatic cells analyzed in this study. The numbers separated by slashes represent the number of cells produced in each experiment. § represents the cells from Pdx1‐GFP highly expressing cells, *represents the single‐cell datasets from published resources (GEO: GSE86225; Li et al, 2018), **represents the single‐cell datasets from published resources (GEO: GSE84324; Yu et al, 2018), and ***represents the single‐cell datasets from published resources (GEO: GSE89798; Sznurkowska et al, 2018).
- FACS gating strategies for purifying pancreatic cells at multiple developmental stages from various mouse strains. The pancreatic tissues from WT embryos were used as negative controls (upper panel). The dashed line in the “E10.5 Pdx1‐GFP” gating plot separates the cells with higher GFP expression from cells with lower expression.
- Generation of the Gcg‐P2A‐GFP strain by inserting P2A and GFP DNA sequences before the stop codon.
- Immunofluorescence staining of the GCG in 8‐week‐old mouse islets verified the high quality of the Gcg‐P2A‐GFP strain. Scale bars: 50 μm.