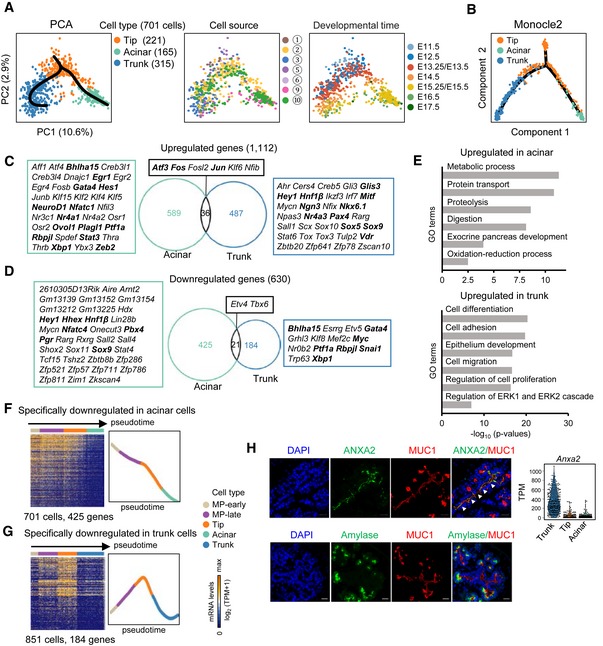
Figure 4. Differentiation pathway of the tip cells.

-
APCA plots of tip, acinar, and trunk cells. The colors denote the cell types (left) and cell source (middle), the circled number indicating the cell source labeled in Fig 1A, and the developmental time (right). The simultaneous principal curves indicate the developmental pathways of tip cell differentiation (left).
-
BDevelopmental trajectory of tip, acinar, and trunk cells produced by Monocle2 analysis. The colors denote cell types.
-
C, DUpregulated (C) and downregulated (D) genes in acinar and trunk cells compared with tip cells. The numbers indicate gene counts. TFs are listed next to the Venn diagrams. The bolded TFs are known to be important for pancreas development.
-
ESelected GO terms of upregulated genes in acinar or trunk cells.
-
F, GHeat maps showing the expression of acinar‐ (F) or trunk‐ (G) specifically downregulated genes in pseudotemporally ordered cells. The mean relative expression levels of the genes are shown on the right.
-
HImmunofluorescence staining of MUC1 and ANXA2 or amylase in paraffin sections of E14.5 pancreatic tissues. Scale bars: 20 μm. The gene expression level (TPM) of Anxa2 is shown on the right. The arrowheads indicate the trunk domain.
