. 2019 Feb 8;38(8):e100164. doi: 10.15252/embj.2018100164

Figure EV4. Dynamics of cell type feature genes during multipotent pancreatic progenitor differentiation.
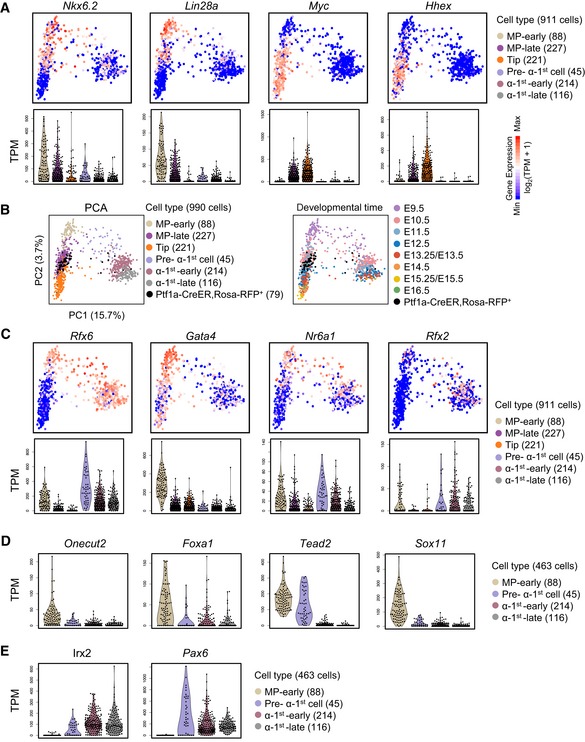
Figure EV4

  • A
    Expression levels (TPM) of selected genes listed in Fig 3B are projected onto the PCA plot (upper) shown in Fig 3A or presented as violin plots of each cell population (down).
  • B
    E11.5 Ptf1a‐CreER; Rosa‐RFP+ cells were intermingled with E11.5 Pdx1‐Cre; Rosa‐RFP+ or Pdx1‐GFP+ cells.
  • C
    Expression levels (TPM) of selected genes listed in Fig 3B are projected onto the PCA plot (upper) shown in Fig 3A or presented as violin plots of each cell population (down).
  • D, E
    Violin plots showing the expression levels (TPM) of selected genes in clusters‐1, 2 (D) and clusters‐4, 5 (E) described in Fig 3E in MP‐early and various stages of α‐1st cells.