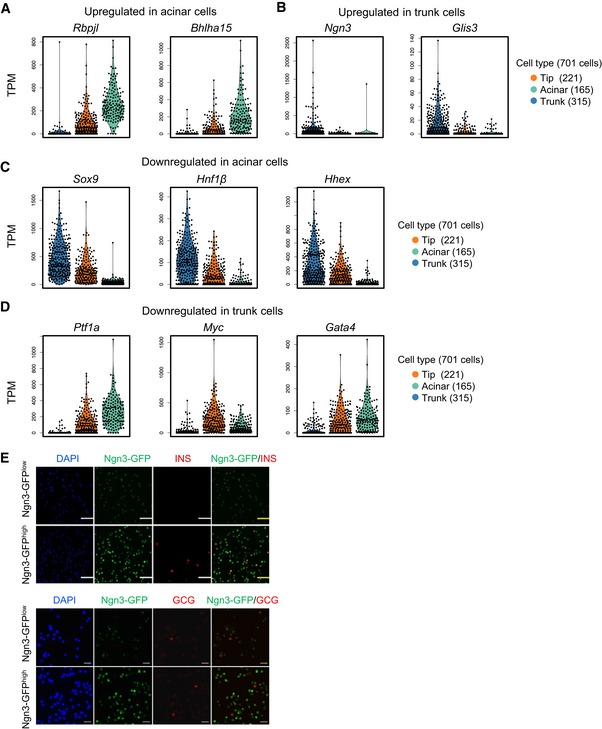
Figure EV5. Dynamics of cell type feature genes during tip cell differentiation.

-
A, BViolin plots showing the expression levels (TPM) of selected upregulated genes in acinar (A) and trunk (B) cells.
-
C, DViolin plots showing the expression levels (TPM) of selected downregulated genes in acinar (C) and trunk (D) cells.
-
EImmunofluorescence staining of insulin and glucagon in sorted Ngn3‐GFPlow and Ngn3‐GFPhigh cells at E14.5. Scale bars: 50 μm (upper), 20 μm (down).
