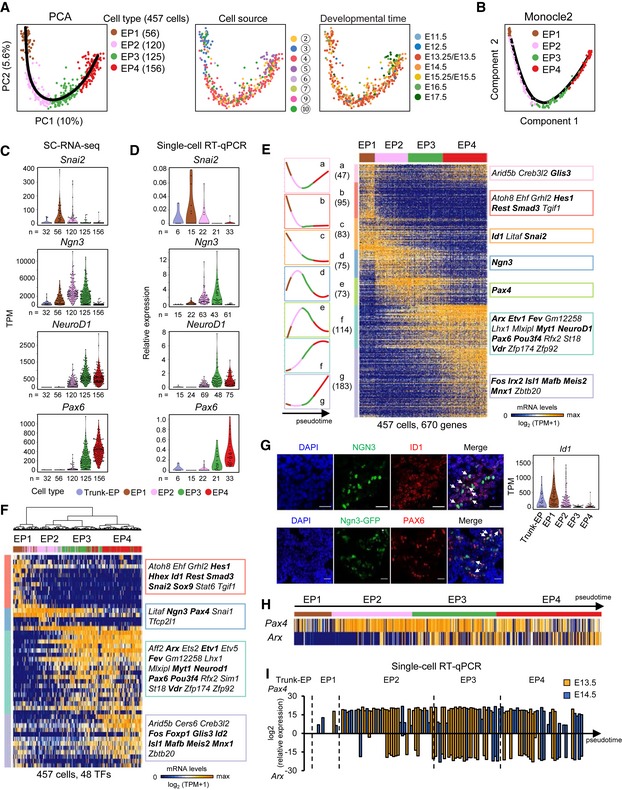
Figure 7. Four stages of EP cell development.

-
APCA plots of EP cells. The colors denote cell types (left) and the cell source (middle), the circled number indicating the cell source labeled in Fig 1A, and the developmental time (right). The simultaneous principal curve indicates the developmental pathway of EP cells.
-
BDevelopmental trajectory of EP cells produced by Monocle2 analysis.
-
C, DThe violin plots show the gene expression levels (TPM) in trunk‐EP and four stages of EP cells (C). The expression levels were verified via single‐cell RT–qPCR with normalization to Gapdh expression (D). n: cell counts.
-
EHierarchical clustering of the pseudotemporally ordered cells plotted in the PCA (A) (PC1 and PC2, P < 10−15). The mean relative expression level and TF list of each gene cluster are shown on the left and right of the heat map, respectively. The bolded TFs are known to be important for pancreas development. Gene counts are shown in brackets.
-
FHierarchical clustering of EP cells with TFs. The TFs listed on the right were high‐loading genes (PC1 and PC2, P < 10−13) in the PCA (see Materials and Methods).
-
GImmunofluorescence staining of ID1, Ngn3, and DAPI in paraffin sections of E14.5 WT pancreas (upper) or of PAX6 and DAPI in cryosections of E14.5 Ngn3‐GFP pancreas. Scale bars: 20 μm. The arrows indicate the Ngn3+ID1+ or Ngn3+PAX6+ cells. The violin plots show the Id1 expression levels (TPM) in trunk‐EP and four stages of EP cells. The expression pattern of Pax6 is shown in (C).
-
HArx and Pax4 expression patterns in EP cells. Individual cells are arranged in the same order as in (E).
-
ISingle‐cell RT–qPCR verified the expression levels of Pax4 and Arx in trunk‐EP cells and in four stages of EP cells at E13.5 (yellow) and E14.5 (blue) with normalization to Gapdh expression. Individual cells are arranged by pseudotime. The dashed lines indicate the boundaries of stages.
