-
A
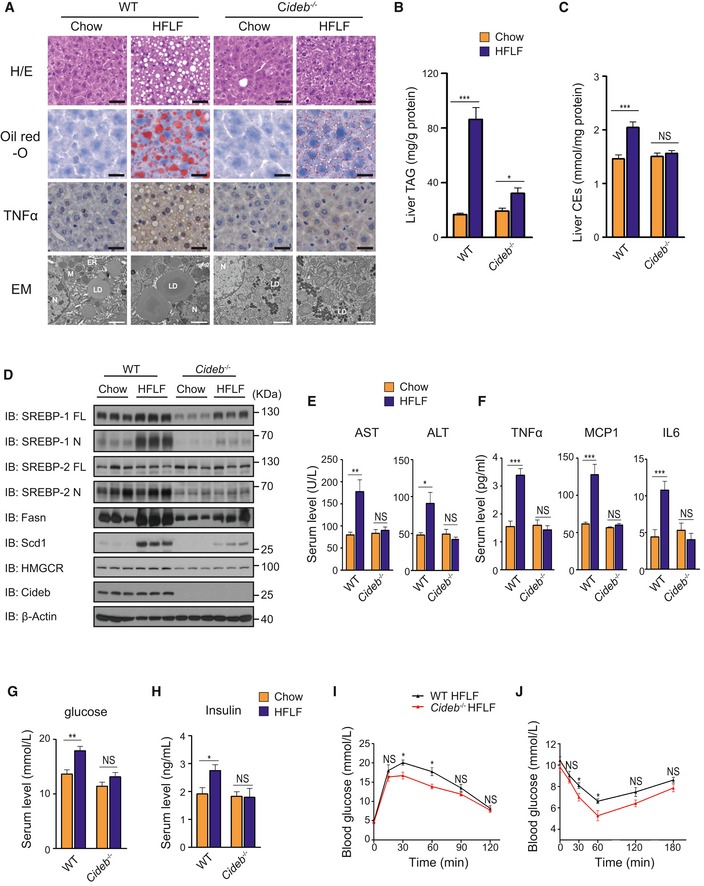
Liver morphology of WT and Cideb
−/− liver under chow diet and HFLF diet. H/E staining, oil red‐O staining, immunohistochemistry, and ultrastructure (Electron Microscope) were performed. Scale bar represented 50 μm in the upper three rows of images and 2 μm in the bottom row of images. LD: lipid droplet; ER: endoplasmic reticulum; M: mitochondrial; N: nucleus.
-
B, C
Total liver TAG levels (B) and liver cholesterol ester levels (C) of WT and Cideb
−/− mice under chow diet and HFLF diet (n = 8 per group).
-
D
Loss of Cideb inhibits diet‐induced SREBP activation. IB of hepatic SREBP processing and lipogenic enzyme levels (Fasn, Scd1) of WT and Cideb
−/− mice under chow diet and HFLF diet.
-
E
Serum AST and ALT levels of WT and Cideb
−/− mice under chow diet and HFLF diet (n = 8 per group).
-
F
Cideb deficiency alleviates the whole body inflammation response. Serum TNFα, MCP1, and IL6 levels of WT and Cideb
−/− mice under chow diet and HFLF diet (n = 8 per group).
-
G, H
Serum fed glucose levels (G) and insulin levels (H) of WT and Cideb
−/− mice under chow diet and HFLF diet (n = 8 per group).
-
I
Glucose tolerance test (GTT) of WT and Cideb
−/− mice under HFLF diet (n = 5 per group).
-
J
Insulin tolerance test (ITT) of WT and Cideb
−/− mice under HFLF diet (n = 5 per group).
‐test.

