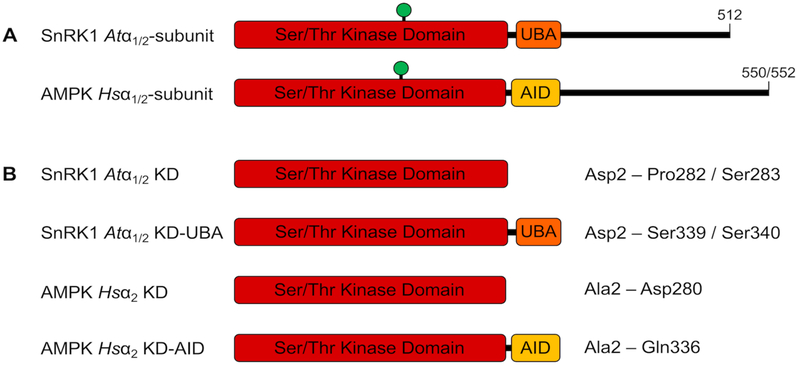
Figure 1.
SnRK1 and AMPK catalytic α-subunits. (A) Both plant and mammalian α-subunits comprise an N-terminal KD followed immediately C-terminally by either a UBA or an AID, respectively. Green circle represents the phosphorylated T-loop threonine. (B) Constructs used in the study, with amino acid boundaries indicated.

