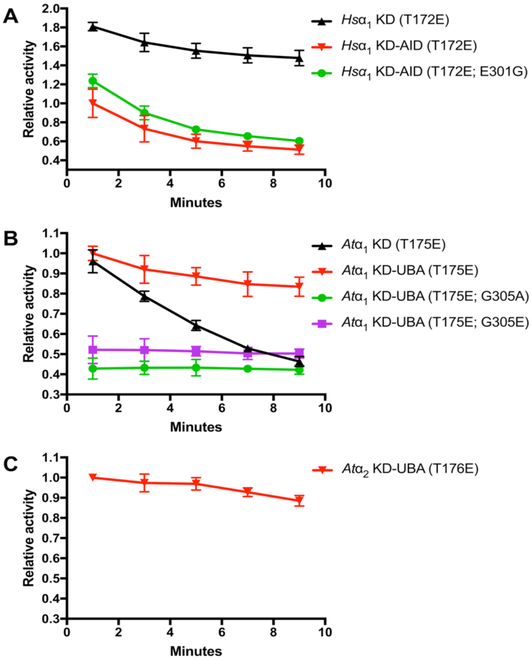
Figure 4.
UBA/AID influence on catalytic activity of T-loop threonine-to-glutamate phosphomimetic mutants for Hsα2 (A), Atα1 (B), and Atα2 (C). Relative activity (left y-axis) is given a value 1 that for the respective KD-AID/UBA over the initial (0 to 2 minutes) period. Absolute activity (right y-axis) is indicated in pmol phosphate min−1 nmol−1 enzyme. Activity levels for each point represent the average activity for each two-minute period between which the points are plotted.

