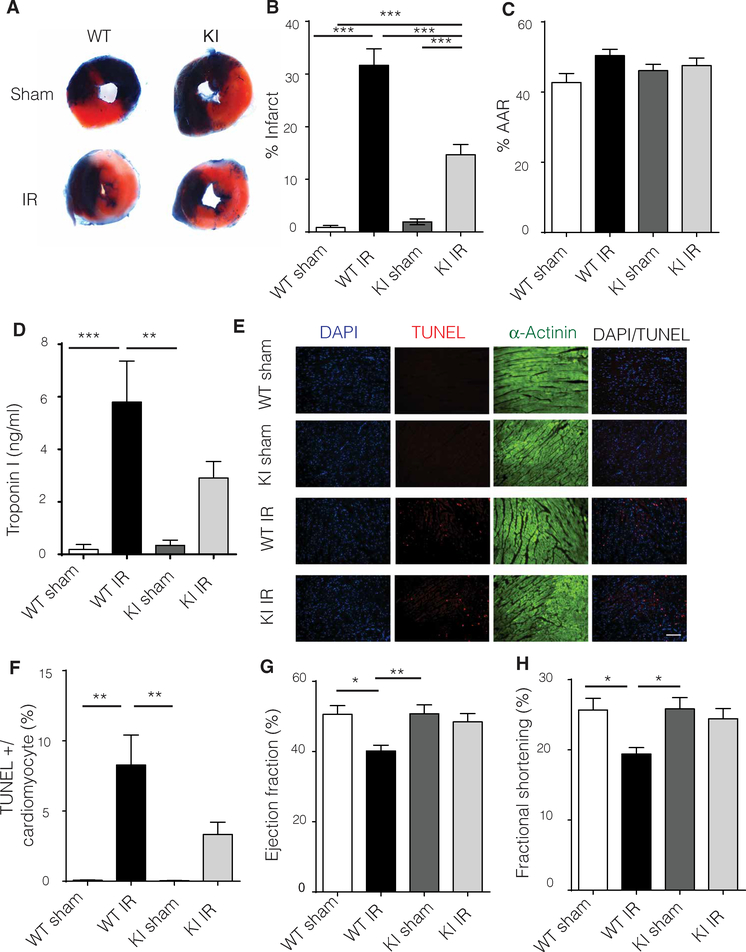
Fig. 2. Limiting mitochondrial GRK2 translocation post-IR injury significantly reduces LV infarct size through diminished myocyte cell death.
(A) Representative Evans blue staining of hearts 24 hours after IR injury of WT and KI mice. Blue area is the area not at risk (ANAR), red is the AAR, and white represents the infarct. (B) Quantification of Evans blue staining (n = 19 to 20 hearts per group). (C) %AAR or the area subjected to injury in WT and KI mice (n = 19 to 20 hearts per group). (D) Serum troponin I levels were measured 24 hours post-IR injury in WT and KI mice (n = 5 to 6 mice per group). (E) TUNEL (red) analysis of cardiac tissue from WT and KI mice counterstained with β-actinin (green) to visualize cardiomyocytes; 4′,6-diamidino-2-phenylindole (DAPI) was used as a nuclear marker (blue). Scale bar, 100 μm. (F) TUNEL quantification of images in (E) (n = 3 to 5 hearts per group). (G) Echocardiography ejection fraction percentage in WT and KI mice 24 hours post-IR injury reveals improved cardiac function in the KI animals (n = 19 to 20 mice per group). (H) LV fractional shortening percentage as determined by echocardiography (n = 19 to 20 mice per group). Statistical significance was determined by ANOVA. Data are shown as means ± SEM; *P < 0.05, **P < 0.01, ***P < 0.005.

