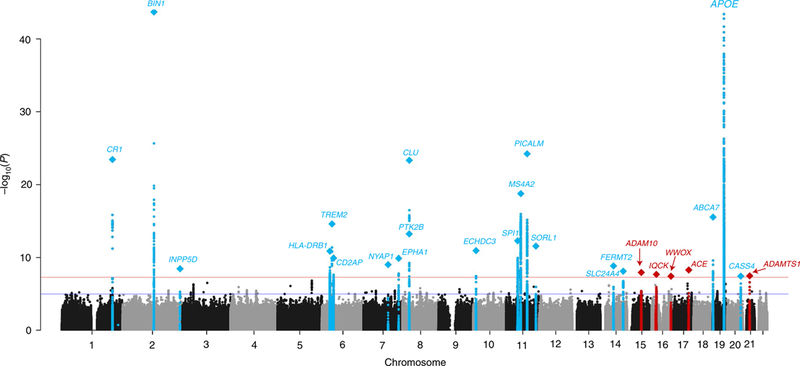
Fig. 1 |. Manhattan plot of meta-analysis of stage 1, 2, and 3 results for genome-wide association with Alzheimer’s disease.

The threshold for genomewide significance (P < 5 × 10⁻⁸) is indicated by the red line, while the blue line represents the suggestive threshold (P < 1 × 10⁻⁵). Loci previously identified by the Lambert et al.1 IGAP GWAS are shown in blue and newly associated loci are shown in red. Loci are named for the closest gene to the sentinel variant for each locus. Diamonds represent variants with the smallest P values for each genome-wide locus.
