
Figure 2.
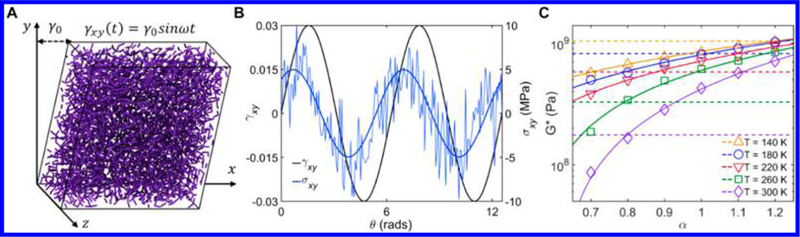
(A) Simulation snapshot of the NEMD oscillatory shear simulation performed on CG-PB. A sinusoidal strain in the form of γ(t) = γ0 sin ωt is imposed in the xy plane. (B) A typical shear stress−strain plot obtained from NEMD. The shear stress outputs are fitted with a sinusoidal function σxy = σ0 sin(ωt + δ). 40 cycles are performed per data point. (C) Complex shear modulus G* of PB measured at f = 1010 Hz for AA (dashed lines) and CG (open symbols) models as a function of α. The solid lines are used to show the trend for CG model data.