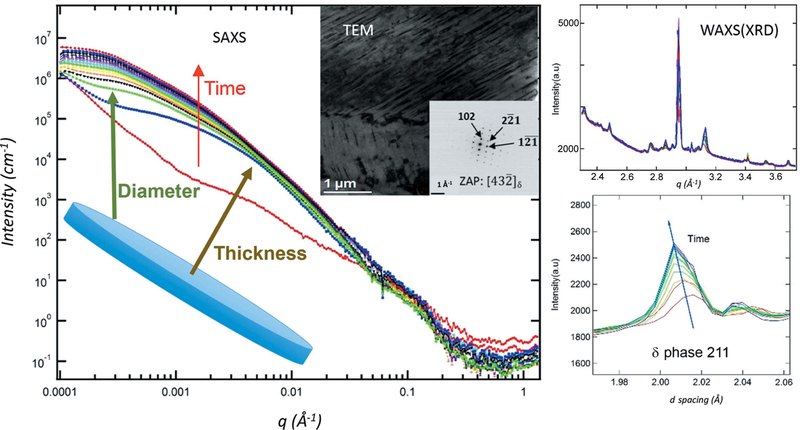
Figure 3.
USAXS/SAXS and WAXS data as a function of annealing time at 1339 K (1066°C) for ATI 718Plus nickel-based superalloy produced by additive manufacturing. The main plot shows the changing USAXS/SAXS data during the anneal, together with the plate-like scattering features modelled. The TEM inset confirms the plate-like morphology of the δ phase. The remaining plots show theWAXS diffraction data and the evolution of the δ-phase 211 Bragg peak during annealing.

