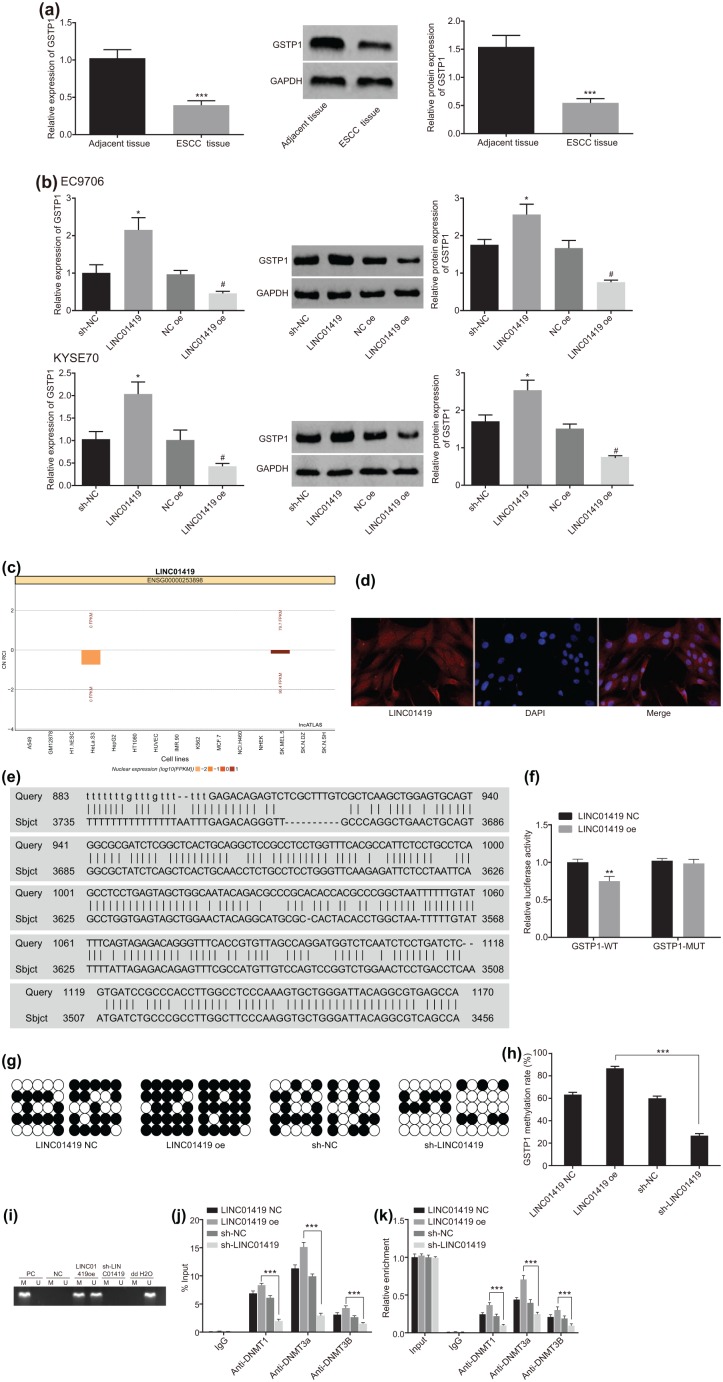
Figure 3.
LINC01419 promotes the methylation of GSTP1 gene.
(a) GSTP1 levels in ESCC tissues detected by RT-qPCR and western blot analysis. *p < 0.05, **p < 0.01, ***p < 0.001 versus adjacent tissues. Statistical values were measurement data, presented as mean ± standard deviation and analyzed using a paired Student’s t test; (b) GSTP1 levels in ESCC cells detected by RT-qPCR and western blot analysis. *p < 0.05 versus the sh-NC group, #p < 0.05 versus NC oe group. Statistical values were measurement data, presented as mean ± standard deviation and were analyzed using analysis of variance; (c) prediction of subcellular localization of LINC01419 by lncATLAS website; (d) LINC01419 is mainly distributed in the nucleus, as observed using FISH; (e) Blsat analysis for LINC01419 and the promoter region of GSTP1 gene; (f) the results of dual luciferase reporter gene assay; *p < 0.05, **p < 0.01, ***p < 0.001 versus LINC01419 NC group; (g) detection of methylation of GSTP1 gene by BSP; (h) quantitative analysis of methylation of GSTP1 gene by BSP. *p < 0.05, **p < 0.01, ***p < 0.001. (i) The methylation of the GSTP1 promoter detected with MSP; (j) ChIP verified the binding of GSTP1 promoter region to DNA methyltransferase in patients with ESCC. *p < 0.05, **p < 0.01, ***p < 0.001, versus the normal group; (k) RIP verified the results of LINC01419 binding to DNA methyltransferase, n = 3. *p < 0.05, **p < 0.01, ***p < 0.001.
Statistical values of luciferase activity of panel (f) were measurement data, presented as the mean ± standard deviation and compared by unpaired Student’s t test. The experiment was repeated three times. Statistical values of panel (h) were measurement data, expressed as mean ± standard deviation and compared by analysis of variance. The experiment was repeated three times. Statistical values of panel (j) and panel (k) were measurement data and were presented as mean ± standard deviation. Comparisons among multiple groups were analyzed using analysis of variance. The experiment was repeated three times.
·, methylation site; º, nonmethylated sites; BSP, bisulfite sequencing polymerase chain reaction; ChIP, chromatin immunoprecipitation; ESCC, esophageal squamous cell carcinoma; FISH, fluorescence in situ hybridization; GSTP1, glutathione S-transferase pi 1; M, methylated; MSP, methylation-specific polymerase chain reaction; NC, negative control; PC, positive control; RIP, RNA immunoprecipitation; RT-qPCR, reverse transcription quantitative polymerase chain reaction; U, unmethylated.

