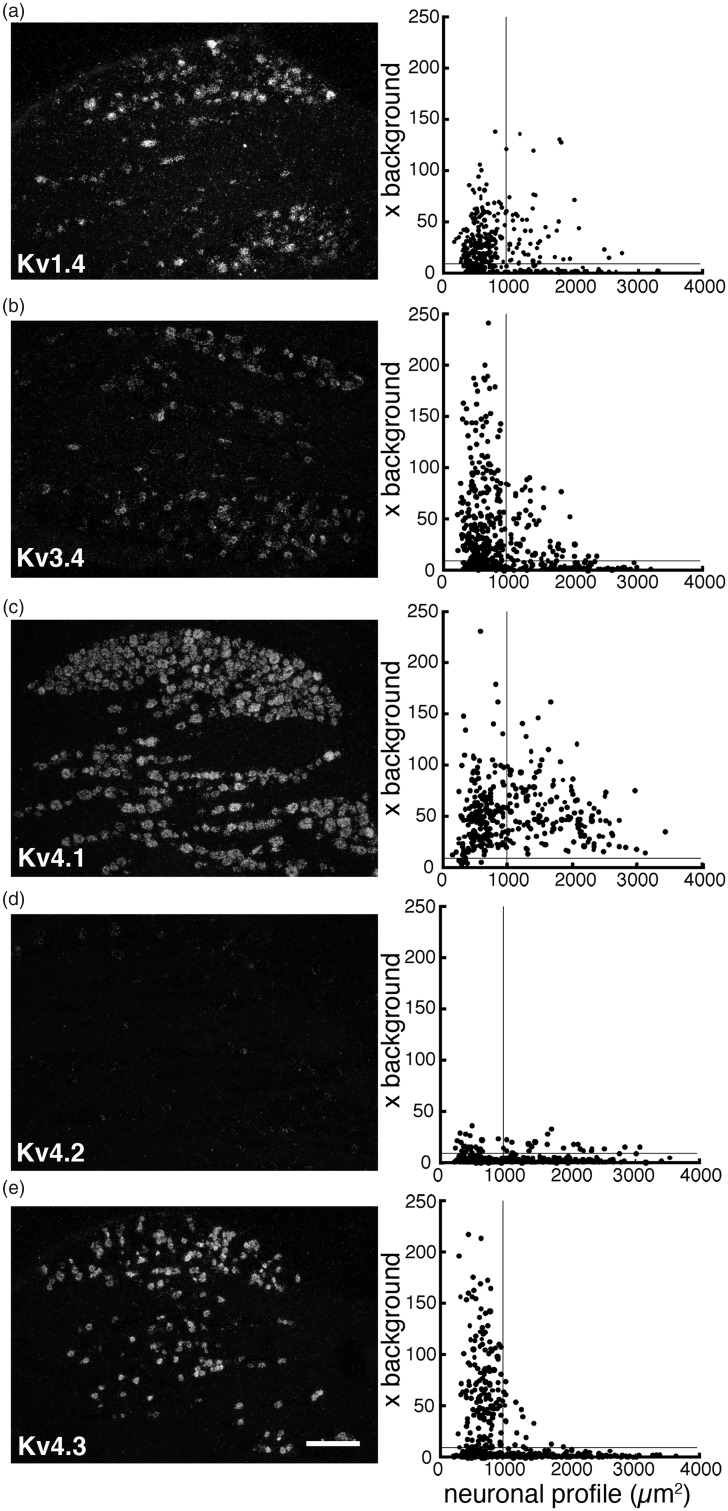
Figure 3.
Expression of five IA-encoding Kv alpha-subunit mRNAs in a naïve rat DRG. DRG sections were processed for ISH histochemistry with 35S-labeled RNA probes and visualized by emulsion autoradiography. Left panels: Representative dark-field photomicrographs of the DRG showing ISH signals for Kv1.4 (a), Kv3.4 (b), Kv4.1 (c), Kv4.2 (d), and Kv4.3 (e) mRNAs, respectively. Scale bar = 500 μm. Right panels: Scatterplot diagrams of the left-hand panels. Individual neuronal profiles are plotted according to the cross-sectional area (μm2; along the x-axis) and signal intensity (x background; along the y-axis). The lines at S/N ratio = 10 indicate the borderline between the negatively and positively labeled profiles.DRG: dorsal root ganglion; ISH: in situ hybridization; Kv: voltage-gated potassium channel; S/N: signal to noise.

