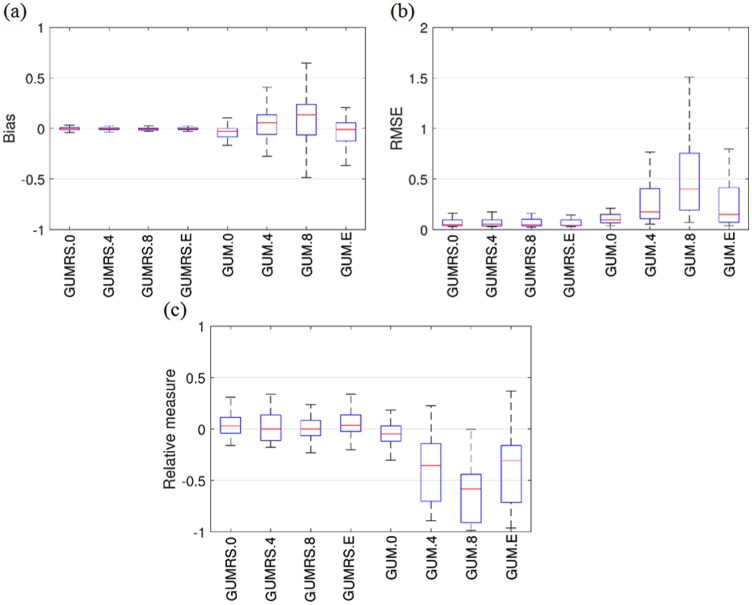
Figure 3.
(a) Bias values, (b) root mean square error of the parameter estimators, and (c) relative measure of the standard error estimators, for 1,000 people and 15 six-point items from the GUMRS and the GUM in the simulation study.
Note. The suffixes “.0,”“.4,”“.8,” and “.E” added to GUMRS and GUM denote the correlations used to generate data from the GUMRS but analyzed with both the GUMRS and the GUM. GUMRS= general unfolding model for response styles; GUM = general unfolding model.

