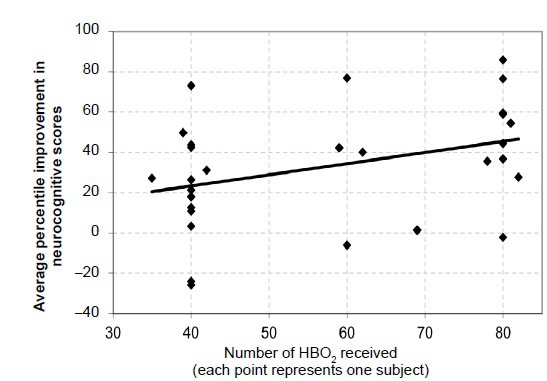
Figure 6.

Average improvement in each subject's neurocognitive test scores bases on number of HBO2 sessions received.
Note: Each point in the graph represents one subject. The line through the points is a best-fit, linear regression (y=0.5539x + 1.1863) of individual subjects who have undergone 35 and up to 82 hyperbaric oxygen treatments. The trend line slope is 0.55; r = 0.3685, P = 0.038. HBO2: Hyperbaric oxygen.
