
Figure 4.
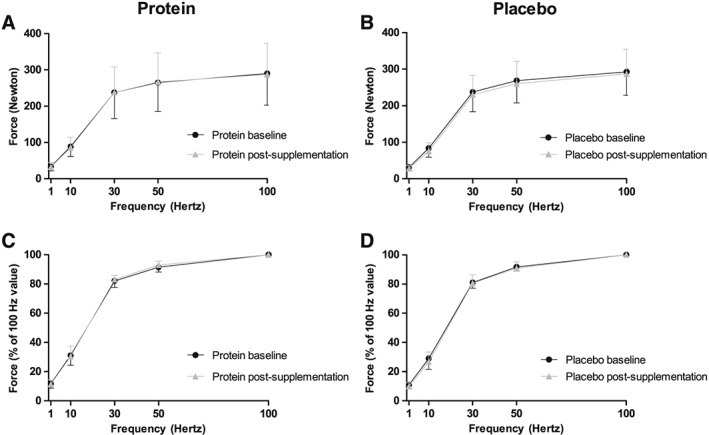
Force responses to different stimulation frequencies (1, 10, 30, 50, and 100 Hz) are given in absolute forces (A and B) and normalized for peak isometric 100 Hz force (relative) (C and D) at baseline and after the supplementation period for the protein group, n = 20 (A and C) and for the placebo group, n = 24 (B and D). At baseline, the absolute and relative peak forces of the quadriceps were similar between the protein and placebo groups (P Interaction = 0.75 and P Interaction = 0.75, respectively). After the supplementation, again no between‐group differences were observed in the absolute and relative quadriceps peak forces (P Interaction = 0.33 and P Interaction = 0.20, respectively). Data are presented as mean ± standard deviation.