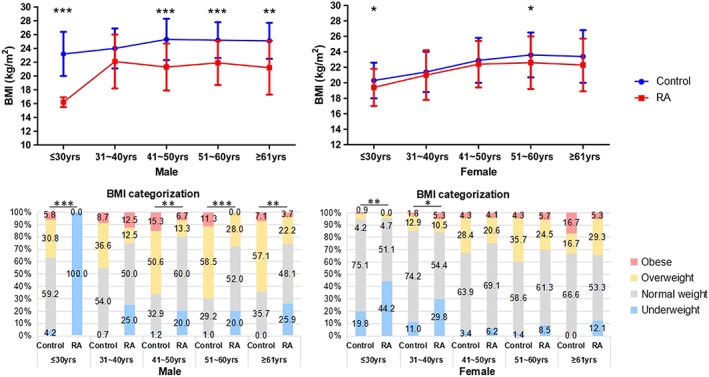
Figure 1.

Comparisons of BMI between RA patients and control subjects in age and gender stratification. Underweight, BMI < 18.5 kg/m2; Normal weight, 18.5 kg/m2 ≤ BMI < 24 kg/m2; Overweight, 24 kg/m2 ≤ BMI < 28 kg/m2; Obese, BMI ≥ 28 kg/m2; * P < 0.05, ** P < 0.01, *** P < 0.001. Male: ≤30 years old, control n = 380, RA n = 4; 31–40 years old, control n = 322, RA n = 8; 41–50 years old, control n = 85, RA n = 15; 51–60 years old, control n = 106, RA n = 25; ≥61 years old, control n = 14, RA n = 27. Female: ≤30 years old, control n = 429, RA n = 43; 31–40 years old, control n = 326, RA n = 57; 41–50 years old, control n = 116, RA n = 97; 51–60 years old, control n = 70, RA n = 106; ≥61 years old, control n = 12, RA n = 75.
