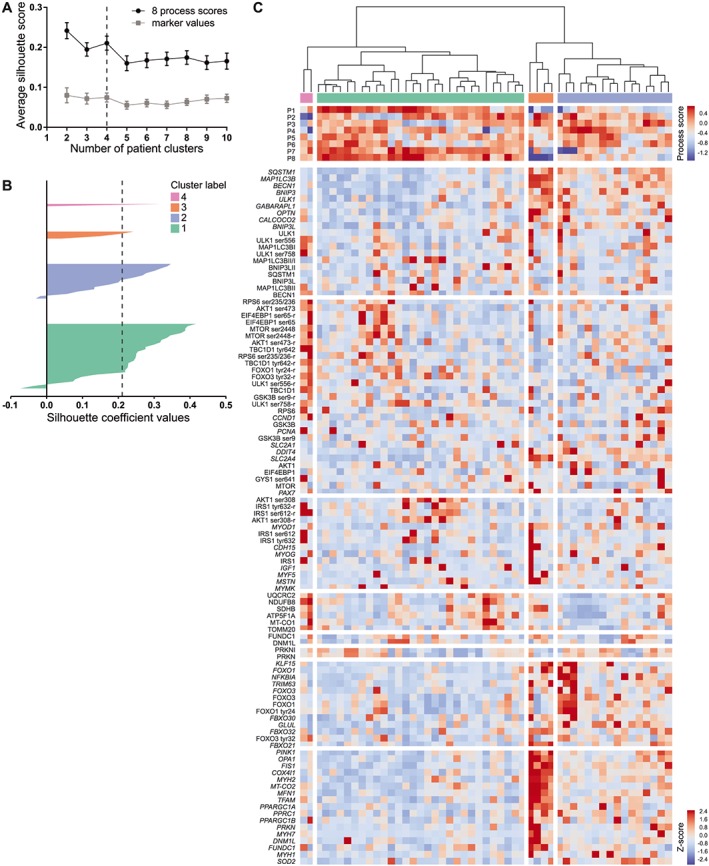
Figure 2.

Hierarchical clustering of patients. (A) Silhouette scores for n clusters (mean ± SEM). Clustering based on raw molecular rehabilitation responses (marker values; i.e. no data reduction) is indicated in grey; clustering based on eight process scores is indicated in black. (B) Patients individual silhouette coefficient values per cluster. (c) Dendrogram and clustered heatmap of individual marker rehabilitation responses (Z‐scores) and process scores.
