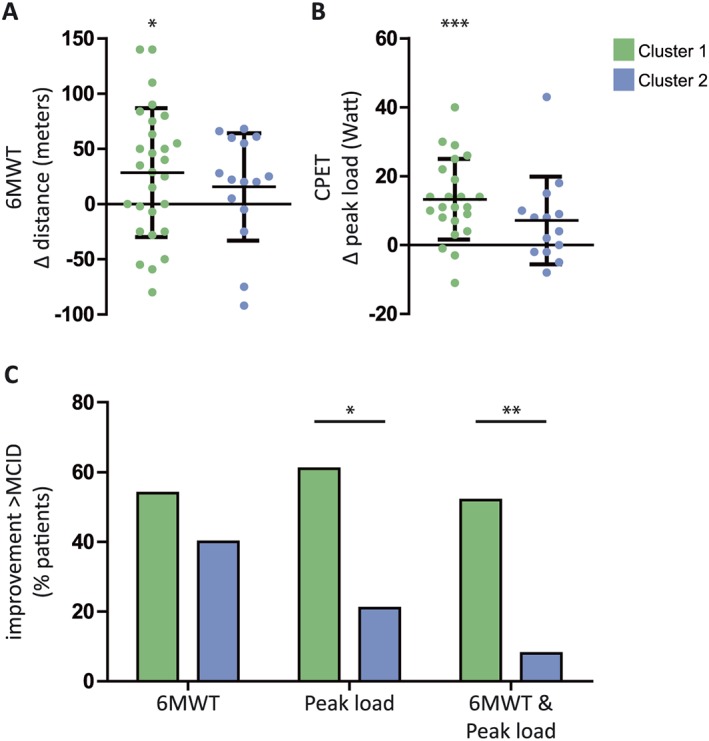
Figure 4.

Functional rehabilitation responses per cluster. Individual rehabilitation‐induced changes. (A) Distance (metres) walked in 6 min walk test (6MWT), n = 28/15. (B) Peak load (W) on a cycle ergometer test, n = 23/14. Data expressed as mean ± SD. (C) Percentage of patients with a change in 6MWT, peak load, or both, exceeding the minimal clinically important difference (MCID; 6MWT: 25 m, peak load: 10 W). * P < 0.05, ** P < 0.01, *** P < 0.001, indicating significance of within‐group rehabilitation responses or significance of differences between indicated groups.
