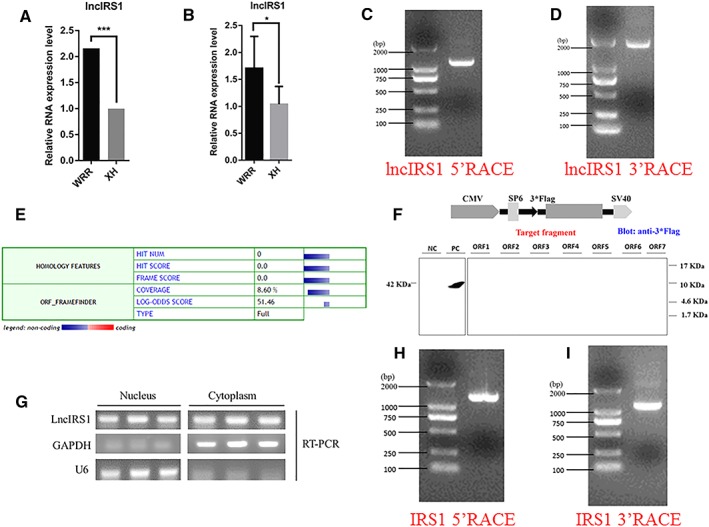
Figure 2.

Identification of lncIRS1. (A) RNA sequencing found that lncIRS1 expression was up‐regulated in hypertrophic broilers compared with leaner broilers (q value=0.000652) and this expression pattern was confirmed by qPCR. The data are shown as the mean ± SEM with *P < 0.05 (B). (C) Results of lncIRS1 5'RACE. 5'RACE product, 1169 bp. (D) Result of lncIRS1 3'RACE. 3'RACE product, 1909 bp. (E) The coding ability predication of lncIRS1. Analysis was obtained from the coding potential calculator (http://cpc.cbi.pku.edu.cn/) based on evolutionary conservation and ORF attributes. (F) Western blot analysis of the coding ability of lncIRS1. The possible seven ORFs of lncIRS1 were cloned into the eukaryotic expression verctor pSDS‐20218 with a 3*Flag tag. Untransfected DF‐1 cells were used as negative control (NC) and DF‐1 cells transfected with pSDS‐20218‐β‐actin were used as a positive control (PC). The upper panel shows the model target fragment in the pSDS vector. The lower left panel is the Western blot result of the NC and PC, and the lower right panel is the Western blot result of ORFs 1–7; all samples were probed with Flag antibody (G) LncIRS1 is localized in the cytoplasm and nucleus. RNA was isolated from nucleus and cytoplasm fraction of myoblasts was used to analyse the expression level of lncIRS1 by RT‐PCR. GAPDH and U6 serve as cytoplasmic and nuclear localization controls, respectively. (H) Results of IRS1 5'RACE. 5'RACE product, 1184 bp. (I) Result of IRS1 3'RACE. 3'RACE product, 1075 bp. LncRNA, long noncoding RNA; RACE, rapid amplification of cDNA ends; RT‐PCR, real‐time PCR.
