
Figure 6.
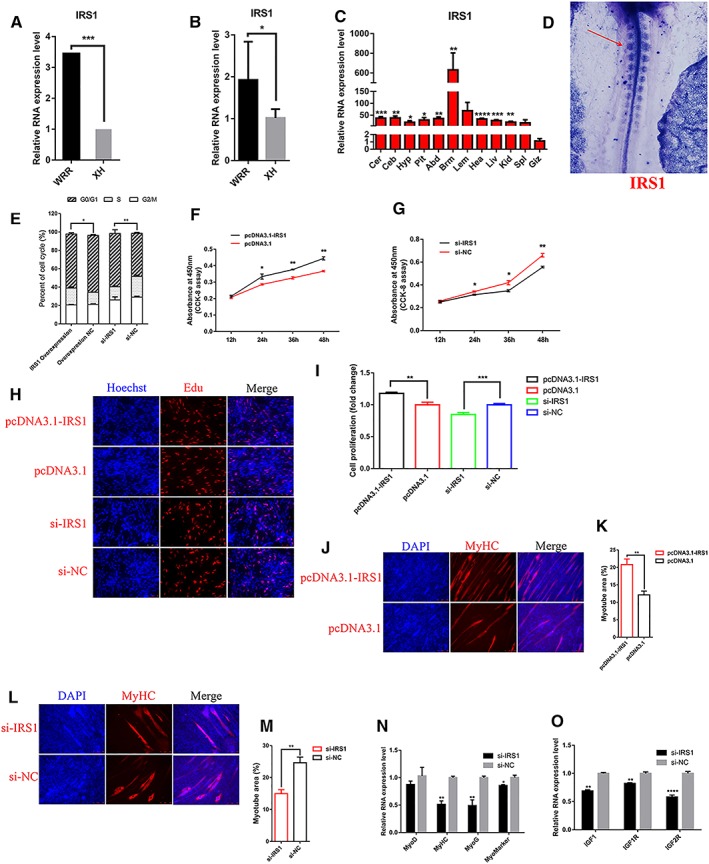
IRS1 promotes myoblast proliferation and differentiation. (A) RNA‐seq analysis found that IRS1 was up‐regulated in hypertrophic broilers, and this expression pattern was validated by qRT‐PCR (B). (C) The RNA expression level of IRS1 in 12 different tissues in leaner broilers and expression was normalized to Giz. (D) Whole‐mount in situ hybridization showed that IRS1 are expressed in the forming somites in HH10 chick embryo Red arrow indicates IRS1 expression location. (E) Cell cycle analysis of myoblasts at 48 h after transfection of pcDNA3.1‐IRS1 and pcDNA3.1 empty plasmid, or si‐IRS1 and si‐NC. (F) CCK‐8 assay was performed to assess the effect of IRS1 overexpression on myoblast proliferation. (G) CCK‐8 assay was performed to assess the effect of IRS1 knockdown on myoblast proliferation. (H) EdU and Hoechst (nuclei) staining analysis after transfection of pcDNA3.1‐IRS1 and pcDNA3.1 empty plasmid, or si‐IRS1 and si‐NC in proliferating myoblast, scale bars are 50 μm. (I) The proliferation rate of myoblast cells transfected with pcDNA3.1‐IRS1 and pcDNA3.1 empty plasmid, or si‐IRS1 and si‐NC. (J, L) Myoblast cells transfected with pCDNA3.1‐IRS1, or si‐IRS1 were induced to differentiate for 72 hr then stained with MyHC antibody and DAPI (nuclei). Scale bars are 100 μm. (K, M) Myotube area (%) was determined at 72 h after transfection of pcDNA3.1‐IRS1 or si‐IRS1. (N) Knockdown of IRS1 decreased the RNA expression level of myoblast cell differentiation associated genes, including MyoD, MyoG, MyHC, and MyoMarker. (O) Knockdown of IRS1 decreased the RNA expression level of IGF‐1 pathway associated genes, including IGF1, IGF1R, and IGF2R. Results are shown as the mean ± SEM of three independent experiments. Independent sample t‐test was used to analysis the statistical differences between groups. * P < 0.05, ** P < 0.01, *** P < 0.001, and **** P < 0.0001.